Historical: Q1 2026 Market Performance
The total Personal Computing Device (PCD) market — comprising traditional PCs and tablets — posted 2.8% year-over-year growth in Q1 2026, with combined shipments reaching 103.3 million units. PC shipments grew 3% YoY with 65.6 million units, a resilient result against a backdrop of deteriorating macroeconomic conditions and a growing memory shortage. The positive outcome was largely the product of pull-forward demand, as both consumer and commercial buyers accelerated purchases ahead of anticipated price increases and limited product availability. The ongoing Windows 10 end-of-life migration cycle and new product introductions provided additional momentum. Despite the growth, the underlying picture was weaker. Growth trends declined sharply across all regions as component shortages and macro pressures intensified. Geopolitical tensions in the Middle East further complicated the supply chain, disrupting sea corridors — particularly those connecting Asia and EMEA — and driving up freight costs, which are beginning to flow through to end-user prices. Tablet shipments grew 2.4% YoY with 35.4 million units. Growth was similarly driven by inventory pull-ins ahead of memory price increases and supply disruptions. Entry-level PC shortages also redirected some buyer demand toward tablets across both consumer and commercial segments. Growth was concentrated in the consumer segment and in emerging markets. The broader commercial segment declined, with education as a notable exception — supported primarily by Japan’s GIGA program. Tablets faced relatively milder cost pressures than PCs, as memory represents a smaller share of the overall bill of materials, giving vendors more room to absorb increases without immediately passing them to buyers.
Forecast: Full-Year 2026 and Beyond
The total PCD market forecast for Q2 2026 has been revised to −8.9% year-over-year, and the full-year 2026 outlook has been revised to −10.4% year-over-year, with total shipments expected to reach 401.9 million units. The downward revision reflects erosion of consumer purchasing power amid regional inflation and currency volatility in many key markets, compounded by memory and storage shortages that are proving more severe than anticipated in the previous forecast cycle. The impact is expected to carry into 2027, with market stabilization not expected before 2028. Over the longer term, the market is projected to transition to a steady, replacement-driven cycle characterized by modest growth, premiumization, and shifting demand dynamics.
IDC forecasts global PC shipments will decline 11.3% for full-year 2026, with conditions expected to worsen progressively through Q4, when year-over-year declines could reach 20%. The primary driver is a persistent memory shortage for which no meaningful relief is expected before end of 2027. As a consequence, PC average selling prices are forecast to rise 18.3% in 2026, and pricing is unlikely to return to 2025 levels even as memory capacity eventually expands.
Tablet shipments for full-year 2026 are forecast to decline 8.6% year-over-year to approximately 138.9 million units. The impact of the memory shortage is expected to be less severe for tablets than for PCs, given memory’s smaller share of the tablet bill of materials. Demand strength in emerging markets — particularly across APeJC and MEA — is expected to continue through the year, though it will not be sufficient to offset broader market weakness.
2026Q1 PCD Historical Promo Chart
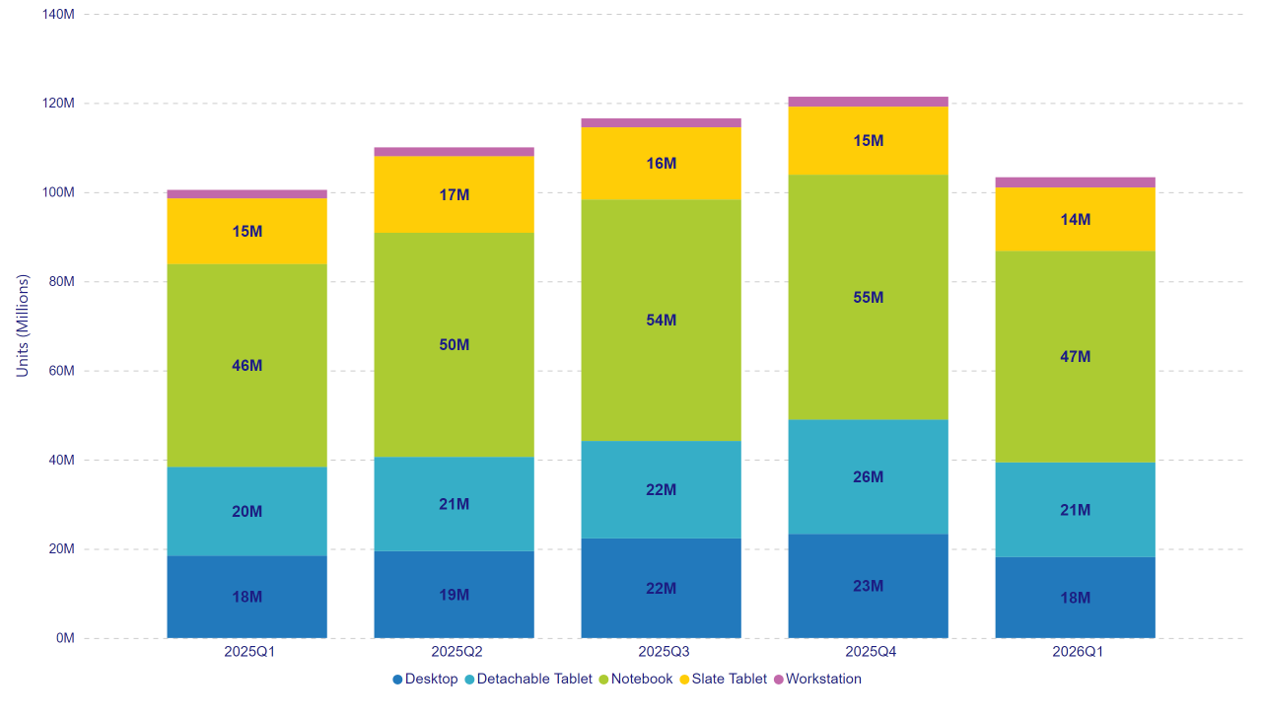
| Quarter | Desktop | Detachable Tablet | Notebook | Slate Tablet | Workstation |
| 2025Q1 | 18,472,961 | 19,903,220 | 45,517,747 | 14,709,706 | 1,905,598 |
| 2025Q2 | 19,485,533 | 21,144,042 | 50,258,650 | 17,173,935 | 1,983,747 |
| 2025Q3 | 22,333,859 | 21,861,357 | 54,172,700 | 16,179,334 | 1,995,215 |
| 2025Q4 | 23,350,150 | 25,642,410 | 54,929,150 | 15,257,783 | 2,226,634 |
| 2026Q1 | 18,165,336 | 21,231,440 | 47,432,504 | 14,217,495 | 2,297,419 |
2026Q1 PCD Forecast Promo Chart
 “
“
| Year | Desktop | Detachable Tablet | DT & Datacenter WS | Mobile WS | Notebook |
| 2026 | 73,486,598 | 81,865,112 | 3,097,399 | 5,139,163 | 181,334,313 |
| 2027 | 73,590,381 | 81,471,552 | 3,112,758 | 4,949,746 | 181,556,222 |
| 2028 | 74,812,666 | 82,537,553 | 3,213,298 | 5,097,382 | 189,687,057 |
| 2029 | 75,158,364 | 83,894,232 | 3,312,913 | 5,276,014 | 196,871,167 |
| 2030 | 77,150,384 | 87,434,311 | 3,452,416 | 5,526,710 | 207,626,700 |