Worldwide Wearable Device Market, 2026Q1
Global wearable device shipments totaled 145.7 million units in Q1 2026, growing 4.3% year over year, according to IDC’s Worldwide Wearable Device Tracker. The quarter reflected steady demand across major form factors, with hearables maintaining their dominant position while smart glasses and rings continued to build momentum as the market’s fastest-growing emerging categories.
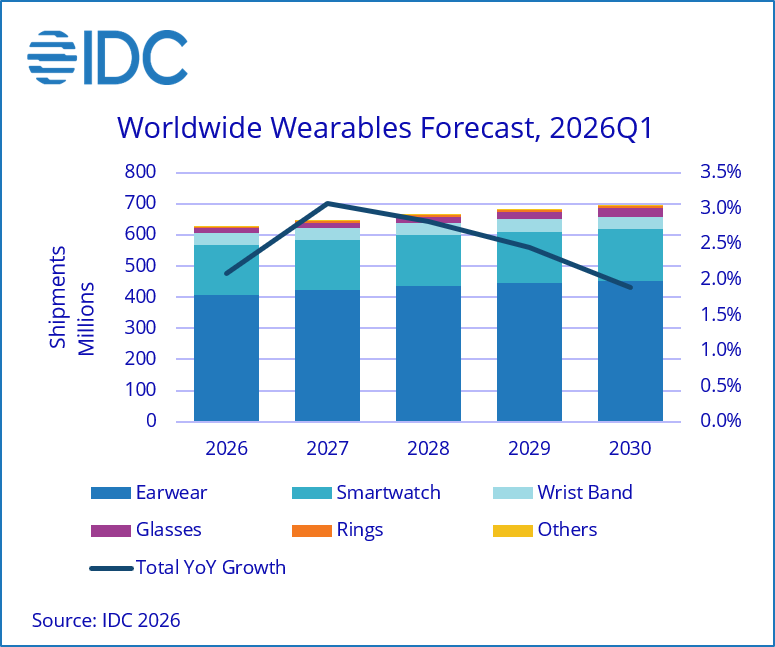
Hearables remained the largest wearable category by a wide margin, accounting for roughly two-thirds of all shipments. The category’s breadth — spanning premium noise-cancelling earbuds, health-sensing devices, and value-tier earphones — continued to attract new users while sustaining solid repeat-purchase cycles. Looking ahead, IDC forecasts hearable shipments to reach 407.6 million units in 2026, growing 4.0% year over year, supported by the continued integration of AI assistant features, real-time translation, and biometric health monitoring into mainstream earwear products.
Smartwatches face modest near-term pressure, with IDC forecasting full-year 2026 volumes of 159.7 million units, a decline of 2.8% year over year. Memory-related supply constraints are expected to keep average selling prices elevated, softening replacement demand in price-sensitive segments. Apple maintained its lead in Q1 2026 at 21.5% unit share, followed by Huawei at 18% and Xiaomi at 9.9%. The category is expected to return to modest growth from 2027 onward as supply conditions gradually ease.
Wristbands are forecast to decline 6.8% in 2026 to 40.2 million units, continuing to face displacement from smartwatches at the mid-tier and growing interest in health-focused alternatives — particularly rings — at the premium end. The decline is expected to moderate significantly through 2028, with the category stabilizing near 39 million units annually as screen-less health-tracking wristbands carve out a durable niche among fitness-engaged users.
Smart glasses stand out as the fastest-growing form factor in IDC’s five-year outlook, with shipments forecast to reach 13.6 million units in 2026, up 41.4% year over year. Demand is being propelled by a broadening pipeline of display-less AI glasses from established players and new entrants, supported by rising consumer interest in content capture and audio consumption. Always-on AI assistants embedded in eyewear continues to grow but is yet to be the primary driver. IDC expects the category to approach 27.3 million units by 2030, representing a compounded annual growth rate of roughly 19%.
Smart rings are also gaining ground, with IDC projecting 4.9 million units in 2026, up 12.8% year over year. Oura continues to anchor the category, but increasing participation from competitors is broadening consumer choice and accelerating market development beyond the early-adopter base. IDC expects rings to reach approximately 6.3 million units by 2030.
Looking across the full horizon, total wearable device shipments are forecast to grow at a 2.6% compound annual rate from 2026 through 2030, reaching an estimated 693.2 million units. Near-term growth is moderated by memory supply tightness and its upward effect on ASPs, while the longer-term outlook is supported by expanding use cases — particularly around health, AI, and connectivity — across all major form factors.
Top 5 Wearable Device Companies
Apple continues to command the largest unit share globally, reinforced by a diversified portfolio spanning smartwatches, earwear, and the broad halo of its ecosystem. Xiaomi ranks second, leveraging aggressive pricing and high-volume distribution, particularly across Asia. Huawei reclaimed the third position in Q1 2026 with 10.6% share, recovering sequentially on the back of strong domestic demand and continued product investment. Samsung held fourth at 6.9%, while Imagine Marketing rounded out the top five at 5.0%, driven primarily by its boAt-branded earwear in India.
| Five Period Market Share: Top 5 by Company, 2026Q1 (Units) | |||||
| Company | 2025Q1 | 2025Q2 | 2025Q3 | 2025Q4 | 2026Q1 |
| Apple | 17.0% | 14.6% | 18.9% | 20.9% | 18.1% |
| Xiaomi | 13.0% | 12.9% | 10.9% | 10.3% | 11.4% |
| Huawei | 11.3% | 10.3% | 7.8% | 7.9% | 10.6% |
| Samsung | 7.9% | 7.2% | 8.1% | 7.7% | 6.9% |
| Imagine Marketing | 5.0% | 5.2% | 7.6% | 3.7% | 5.0% |
| Others | 45.8% | 49.6% | 46.7% | 49.5% | 48.0% |
| Total | 100.0% | 100.0% | 100.0% | 100.0% | 100.0% |
| Source: IDC Quarterly Wearable Device Tracker – 2026Q1 (includes historical and preliminary data). Unit share. Figures may not sum to 100% due to rounding. | |||||