Kimi Antonelli recently became the youngest world champion in Formula 1 history, and the first Italian to win the title after Alberto Ascari’s success in 1953. He won nine races, took seven pole positions and seven fastest laps, and finished on the podium sixteen times in nineteen races, which also helped Mercedes win the constructors’ title.

As the year ends, Kimi’s win got me thinking about what dominated my conversations with public sector technology leaders and technology suppliers around the world. Digital and AI sovereignty were the themes of the year.

IDC defines digital sovereignty as the capacity for digital self-determination by nations, organizations, and individuals and AI sovereignty as the ability to have free choice and control over the design, development, deployment, operation, and governance of AI systems and the technologies they depend on. Because the definition rests on choice and degrees of control, every government leader I talk to defines it slightly differently. In 2026, sovereignty expanded beyond data residency and legal jurisdiction to cover governance, compliance, technology portability, assurance, and resilience, raising questions such as:

  • What operational and governance procedures are applied to ensure compliant, auditable and explainable use of data and AI?
  • Who has access to the data, the metadata, the code, and the physical infrastructure?
  • How easy and affordable is it to make changes to the architecture and technology suppliers supporting it?
  • How can mission-critical AI capabilities keep running if a government or supplier cuts off access to foreign models, chips, or clouds?
  • How much visibility do government CIOs and CTOs have into AI lineage, meaning where a model and its data came from?

Interest is turning into demand. In IDC’s 2026 AI Business Trends survey, 22% of government agencies that use, pilot, or plan to use AI, generative AI, or agentic AI will require sovereignty for all AI workloads, 34% will require it for critical workloads only, and another 36% are piloting or considering sovereign solutions. Geopolitical volatility keeps pushing policymakers toward stricter sovereignty postures. The UK AI Package announced on October 24 shows how: £60 million more for the Sovereign AI Fund, now focused on physical and industrial AI; £60 million for a sovereign AI research and development procurement scheme aimed at health and care and at AI security, assurance, and safe adoption; and £18 million for the UK Advanced Chip Design Academy.

Despite the urgency, IDC’s research shows that eliminating dependence on non-domestic technology suppliers is neither feasible nor desirable for the CIOs, CTOs, chief AI officers, and risk and security leaders who must turn policy into pragmatic choices. In fact, IDC predicts that “Driven by geopolitical anxiety and export controls, the share of governments diversifying a minimum of 2 of 5 AI stack layers through sovereign AI programs will rise from 25% in 2026 to 55% by 2028.” Taiwan’s dominance in advanced chips (below seven nanometers), China’s dominance in rare earth processing, the concentration of the fuel reserves needed for electricity production, and US leadership in AI talent and frontier models all constrain the choices governments have.

Formula 1 gives a way to sort the layers a government can control directly from the ones it can only manage through partners.

The AI stack as an F1 car

IDC’s sovereign AI framework describes five layers: hardware, infrastructure operations, data management, implementation and delivery, ecosystem-delivered AI assets and capabilities. In this blog, I split the implementation and delivery layer, which covers training data sourcing, model development, monitoring and evaluation, and deployment and inferencing, into two: the model and the model harness, which is the software wrapped around a model that controls how it is used.

These five (plus one) layers remind me of an F1 car analogy. The AI hardware is the car’s components; the AI infrastructure is the chassis; the data layer is where the car engineering IP (the unique combination of engine, chassis, tires, airfoils, etc.) sits; the model is the engine; the model harness is the steering wheel; and the ecosystem assets and capabilities are the driver and the team.
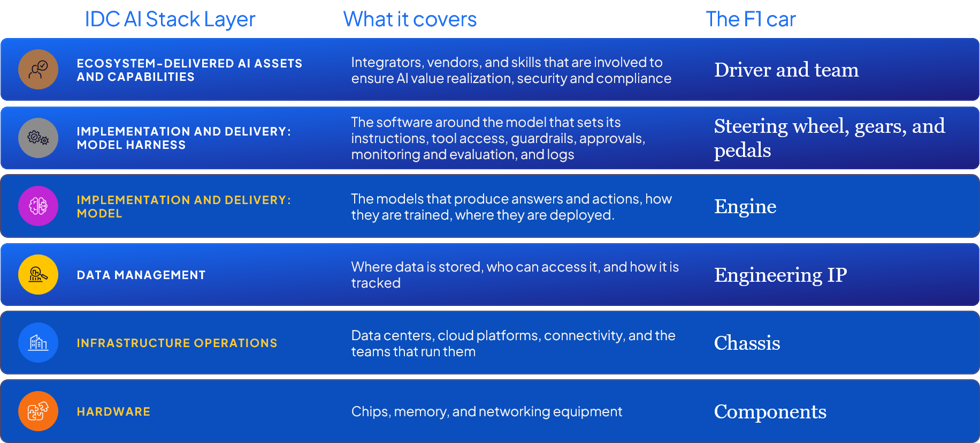
One could argue that there is an additional layer: the energy and water needed to keep the data centers running. Just like a car that does not even start without fuel, a data center does not run without energy and water. I don’t think data is the oil, but that is a debate for another blog.

Maximize control over the IP, the steering, and the knowledge.

Some agencies build the car from its components, deploying GPUs (graphics processing units, the chips that run AI) in their own facilities to maximize control over data residency, operational access, and strategic assurance. However, the more common pattern I see is that governments prioritize control over the data layer, the model harness layer, and ecosystem assets and capabilities.

  • Data: Governments want to control where their data sits, who can read it, and how it moves, as an F1 team protects its engineering IP. The practical levers are data classification, lineage tracking, and residency rules. IDC’s June 2026 Worldwide Digital Sovereignty Survey shows how much groundwork remains: 47% of organizations call full ownership of AI training data critical, yet 31% name data review and classification as a top three barrier to sovereign cloud.
  • Model harness: The model harness decides what AI agents may do, which records they can touch, when a human must approve, what gets logged, how guardrails are enforced when several agents interact, and how the cost and value of AI are monitored. Whoever holds the steering wheel and the pedals sets the car’s speed and direction. Government departments and agencies are taking different approaches to assert control over the model harness layer. Some are relying on off-the-shelf platforms but demanding portability and interoperability guarantees, while others are working with consultants and systems integrators to build custom control planes.
  • Ecosystem assets and capabilities: These determine how well an agency can scale AI, because they bring data, models, and talent together to deliver value in context, much as a driver and team tune the car for every racetrack. Dependence on platform and professional service suppliers’ expertise cannot be eliminated entirely, but leaders can reduce risk, for example by incorporating knowledge transfer into contracts with platform providers and systems integrators.

Reduce the remaining dependencies through choice.

Sovereignty purists might argue that Kimi’s 2026 championship was not truly Italian. He relied on a German car. The team’s engineers, race strategists, and personal trainers included Brits, Spaniards, and Italians. The tires were Italian. The main sponsors came from Malaysia, the US, Germany, the UK, Switzerland, and elsewhere. Even when governments build their own AI infrastructure, dependencies are not eliminated. The UK Ministry of Defence is building its own data center capacity for selected AI and analytics workloads using the Google software stack, while the Australian intelligence community is using AWS to build its top-secret cloud. Even so, these dependencies need to be managed. An interoperable harness makes it affordable to orchestrate and govern multiple models, because the engine can be replaced without rebuilding the car. Open-weight models, whose trained parameters are published for anyone to run, and open source models give agencies alternative engines. At the hardware and data center layers, hybrid multicloud environments, which combine private clouds with global and local providers, are a pragmatic choice. In fact, IDC’s June 2026 Worldwide Digital Sovereignty Survey shows that 73% to 83% of organizations, depending on the workload, add sovereign controls with their existing provider rather than switch to alternative providers. Governments can add customer-held keys and in-country operations to global platforms and qualify regional providers as second sources.

The value of innovation depends on balancing an agency’s resources and capacity, the speed at which it wants to adopt and scale AI, and the degree of control it wants over risk.

I look forward to collaborating with other IDC experts, such as Alan Webber, our global defense, intelligence, and national security lead, and Rahiel Nasir, our global lead for digital sovereignty across industries. Watch for new IDC studies on this topic throughout the rest of 2026 and in 2027.

Massimiliano Claps

Massimiliano Claps - Research Director

Massimiliano (Max) Claps is the research director for the Worldwide National Government Platforms and Technologies research in IDC's Government Insights practice. In this role, Max provides research and advisory services to technology suppliers and national civilian government senior leaders in…

The “SaaSpocalypse” debate has been framed as a question of survival: will AI agents replace application software? Despite all the attention and headlines it grabbed, it’s actually the wrong question. The one keeping buyers up at night is simpler: how much will it cost?

On one hand, buyers are willing and planning to spend more.

Further, IDC’s 2026 SaaS & Agent Path and CX Path studies show companies are willing to pay 21% more, on average, for applications with embedded agents, and 18% say they would even pay a premium of 30% or more.

On the other hand, most tech leaders pay for agent activity through a hybrid pricing model that combines metered usage with a base subscription or per-user fee. Every agent action consumes tokens, and costs scale with usage, which makes spend very hard to forecast. Many organizations are already exceeding their budgets: in IDC’s Future Enterprise Resiliency and Spending Survey (FERS) Wave 5 of 1,666 organizations, 72% said they have overrun their token budgets in the past year.

Agent behavior adds to the problem. IDC’s Worldwide Agentic AI Adoption Guide projects there will be more than a billion AI agents by 2029, and agents do not work the same way every time. One run may iterate more, search more sources, or execute an analysis less efficiently than the last, so the same task can carry a different cost each time.

This sets up a collision. Buyers will pay a premium for agents, but they cannot yet predict or control what those agents will cost to run. Most vendors have not yet given buyers a reliable long-term solution to this problem.

Visibility into spend is not visibility into control

Some vendors are starting to offer real-time dashboards that let customers monitor consumption and set usage limits. This improves visibility, but it does not solve the problem, nor is the visibility itself deep in most cases. A third of organizations (33%) say business unit or department is the most detailed level at which they can track agentic AI costs, and only 14% can track by individual agent or action (IDC AI Business Trends Survey, July 2026, n = 2,188). Even granular dashboards, while they can show what buyers are spending, do little to stop the spending. We found that among organizations that were more than 50% over budget on AI agent spend, 70% had real-time token dashboards (IDC FERS Survey 2026 Wave 4, July 2026, n = 1,835).

Imagine a single team member running a new agent workflow that gets stuck in a loop overnight. The dashboard may show the spike, potentially in real time, but without more granular visibility and controls, the tokens or credits will be spent before anyone can step in, and the ability to trace what happened and keep it from happening again is limited. Visibility is necessary, but it is not enough. The missing piece is the middle ground: controls that keep work going within limits.

Visibility into spend is not visibility into value

Even with limits in place, a dashboard cannot tell buyers what the spend delivered. Consider a company that notices halfway through a monthly billing cycle that it is about to exceed its corporate token budget. Knowing that is useful, but it does not make the decision any easier. The company could tell everyone to stop using their AI tools until the budget resets next month, but that is unrealistic because it would halt all work in progress. Conversely, it could request approval for more budget and let everyone keep working, but the first question any approver will ask is, “What value will we get in return for the additional spend?” Today, that is very hard for most organizations to answer. Until vendors help buyers control consumption and connect it to outcomes, dashboards will show the meter running without indicating what is actually being bought.

The trade-offs vendors face

Common single-metric pricing models solve one problem and create another:

  • Pure metering keeps vendor margins intact but leaves buyers exposed to unpredictable bills and uncertain value.
  • Committed or capped usage gives buyers certainty but risks overpaying or hitting limits.

Most software vendors are embracing a hybrid approach, combining consumption pricing with a per-seat or base subscription price.  This protects vendor margins and ensures a baseline of revenue, but it still leaves customers with poor cost predictability, limited control, and no reliable way to connect spend to value.

What will separate the winners?

Five capabilities matter more than any single agent feature, and we expect them to build on each other over time:

  1. Cost transparency (start now) – Vendors that show buyers exactly what agents consume, and why, will earn trust. Those that hide it will lose renewals.
  2. Control (start now) – Vendors should offer multiple control mechanisms such as caps and alerts by division, team, and workflow; per-run cost ceilings; kill switches for runaway loops and retries; and graceful degradation, such as routing to a lower-cost model, so that hitting a limit does not halt work in progress.
  3. Predictability (build benchmarks as usage reaches critical mass) – Large enterprise vendors with vast customer bases are best positioned here. By anonymizing and aggregating data on agent usage, vendors can provide their customers with benchmarks by department, business process, workflow, etc., all directly in their token dashboards, so buyers gain a sense of what “normal” looks like. This would provide buyers with a sense of cost before committing, as well as an ongoing frame of reference for comparison. Vendors need not wait for scale to offer contractual predictability, such as not-to-exceed pricing, committed spend with rollover, pre-execution cost estimates, rate stability, and more.
  4. Outcome measurement (near-term differentiator) – Many organizations still struggle to quantify AI outcomes, so the vendor that can prove value per task or per process will have a decisive pricing advantage. This is what turns a usage dashboard into a decision tool.
  5. Outcome-based pricing (longer-term goal) – We’re still a few years away from this becoming broadly achievable for most software vendors.  It requires a level of corporate measurement and data readiness that exceeds current levels, but it is the holy grail for buyers, and an inevitable destination that the industry must move toward. One of the biggest roadblocks for AI adoption is trust, and there is no better way to shore up trust than for vendors to directly tie cost to value. 

What should buyers do now?

Before signing, here are five questions you should be asking.

  1. Can I see costs by agent, workflow, and task (not just by department), and spot inefficiencies such as looping and retries?
  2. Can I set hard caps and alerts at every level (division, team, workflow), and what happens when a cap is hit: does work stop, degrade, or bill overage?
  3. Who bears the cost if an agent malfunctions, such as a runaway loop or repeated retries?
  4. Can the vendor estimate what a task or workflow will cost before it runs, and how do tiers or thresholds change my cost per task if agent usage grows rapidly?
  5. Can the vendor show me what value I received for the usage, not just the usage itself, and how will we both measure whether the agent delivered it?

The software vendors that thrive will be those that give customers visibility, control, and proof of value, making the business case for AI agent investment simple to justify and defend.

Eric Newmark

Eric Newmark - Group Vice President & General Manager of IDC's SaaS, Enterprise Software, CX and Workplace Solutions Division

Eric Newmark is Group Vice President & General Manager of IDC’s SaaS, Enterprise Software, CX, and Workplace Solutions Division, which includes several teams of analysts covering SaaS, 18 enterprise application markets, software monetization, business platforms, marketplaces, and services firms focused…
Tiffany McCormick

Tiffany McCormick - Senior Research Director, AI Monetization, Pricing Strategies, and Business Models

Tiffany McCormick is the Senior Research Director for AI Monetization, Pricing Strategies, and Business Models under IDC’s Enterprise Applications team. Mrs. McCormick’s core research coverage includes monetization models for digital products and services including subscription based, value based, usage, consumption,…

Apple’s first foldable hit stores on October 23 after preorders opened on October 16 and sold out within hours. After using the device for almost a month, does the experience support the hype and, more importantly, IDC’s forecast for the device? My verdict is a qualified yes. The details that won me over will likely be the same ones that will decide whether buyers keep using it once the early novelty fades.

One thing is for sure, I’m in a fortunate position. Many buyers are being told their iPhone Duo may not arrive until late January 2027, another signal of the high demand (and supply constraints), so I don’t take my early access lightly. The excitement was real from the minute I opened the box, and I caught myself wondering when I last felt that way about unboxing a device. The open questions are how I’ll feel about the device in a few months and whether the wider consumer base will see it my way.

Is the iPhone Duo ready for its forecast?

Although there are some obvious compromises, mixed reviews, and reports of screen cracks in a small number of devices, IDC’s forecast holds that the Duo will disrupt the global foldable market, capturing 40% global share by the end of 2027. IDC’s forthcoming Market Perspective will provide further analysis and forecast detail on the Duo.

None are big enough to outweigh my impression of Apple’s first foldable, and each can be addressed over time through software and later hardware generations. For many buyers, the Duo does not need to win on the spec sheet, even though many Android foldables have more advanced features in camera or multitasking. For loyal Apple consumers who have only ever used Apple devices, the Android options matter less. This is Apple’s first foldable, and the only foldable many buyers ever considered. The ecosystem loyalty and Apple’s seamless hardware and software integration, and the aspirational power of the brand, will continue to drive the strong demand for the Duo.

So what won me over after a month of use and what are some areas I think the Duo still needs work?

What works well after a month

The nano-texture display. The finish makes everything feel more premium under the finger. I enjoy it most when flipping through the pages of an eBook, where it cuts glare and reflections even in strong sunlight. The nano texture also makes the crease almost invisible. Per IDC surveys, durability and concerns about the crease were the key barriers to foldable adoption. So a crease that fades from notice removes one reason to hesitate.

The transition between screens. You have to feel this one. As you open or close the Duo, graphics move like liquid from the cover screen to the larger display. This has been a crowd pleaser. Nothing functional hangs on it, yet it ranks second on my list, and something Android foldables have yet to showcase.

Multitasking that feels intuitive. Window placement is far more natural than on many Android foldables where I struggled, especially at the start, to get everything where I wanted it. You can’t customize the size of each app or see three windows at once, unlike many Android foldables, however I do not think that will be a concern for many users. The feature that wins me over is app pairing, where paired apps always open together. My favorite pairs so far are Outlook with Teams, and Messages with Photos. Ability to drag and drop content across apps is also oddly pleasing and eases day to day workflow.

What still needs work after a month

App optimization needs time. Many third-party apps aren’t yet optimized for the Duo. On the larger display they sit in the middle of the screen with empty space around them, and on the cover screen some apps leave a black bar on the right. Since extra real estate is the point of a foldable, this is the gap I’d watch most closely, and conversations with other early users suggest it is a real pain point. Whether it remains a minor setback or becomes a major inconvenience depends on how fast developers catch up, especially on popular everyday consumer-focused apps like Snapchat and Instagram. Buyers paying $2,000 or more expect a first-class experience out of the box. Although Apple announced a long list of new apps optimized for launch day on October 22, many gaps remain.

The camera. It takes good pictures but trails the iPhone Pro Max, and at this price I expected slightly better camera quality and a stronger zoom. I take a lot of photos, so this is the point I’m still weighing before making the Duo my primary device. If you mostly consume content, multitask and do basic emails or document reviews on your phone, these camera setbacks may not matter to you.

Face ID. Within the first day I realized how much I miss Face ID, and how much time it saves. Going back to Touch ID feels like a step down on a premium device, and with so many ways to hold and fold the Duo, I keep hunting for the Touch ID sensor. It’s hardly a deal breaker and may just need an adjustment on my side. Still, on the most expensive iPhone yet, why should convenience take a step back?

How many Duos will Apple sell?

IDC forecasts around 7 million Duo shipments in 2026, from roughly one quarter of availability. For context, IDC data shows Huawei and Samsung, the two leading players, shipped 7.2 million and 7 million foldables respectively across all of 2025. Over its first 12 months since launch, we expect the Duo to reach roughly 10 million units.

Apple’s entry is also why IDC expects foldable smartphone growth to return to double digits this year, at nearly 13% year over year in 2026, after the market slowed to 3.9% growth in 2024. IDC expects Apple’s foldable units to keep growing at double digits in 2027, potentially making it the world’s number one foldable vendor by the end of that year with a 40% share of the global market.

Those forecasts rest on demand holding up after launch and how fast Apple is able to ramp up supply. IDC expects supply constraints on the Duo to remain a significant barrier to rapid increase in shipments, with any increase in production to not significantly alter our existing forecast. Current demand outpaces allocation in nearly every market. That tells us how many people want to try the Duo and very little about how many will keep using it, which only usage in the months after launch will show.

What Apple, developers, and suppliers should do next

The real test starts when the queue clears. Apple has to ease its supply bottleneck so production catches up with demand and frustrated buyers don’t drift away during wait time. Developers should optimize the most popular everyday apps for the larger display, which is the quickest route to making the Duo feel like a finished product. Apple then needs to close the Face ID and camera gaps over the next generations. For Android foldable vendors, the Duo’s screen transition now sets the bar.

For now, the signals are strong. Luckily for Apple, the high price and supply scarcity have turned the Duo into a status symbol, which helps drive the initial demand. However, early excitement gets people through the door. Whether they stay depends on how well the Duo fits into their day and if the overall experience outweighs the current setbacks, especially once that excitement wears off.

Nabila Popal

Nabila Popal - Senior Director, Data & Analytics

Nabila Popal is Senor Director with IDC's Data & Analytics team, specializing in Mobile Phones, PC Monitors and other consumer devices.  Ms. Popal is responsible for the global research and quality and timely delivery for her respective technologies, coordinating with regional…

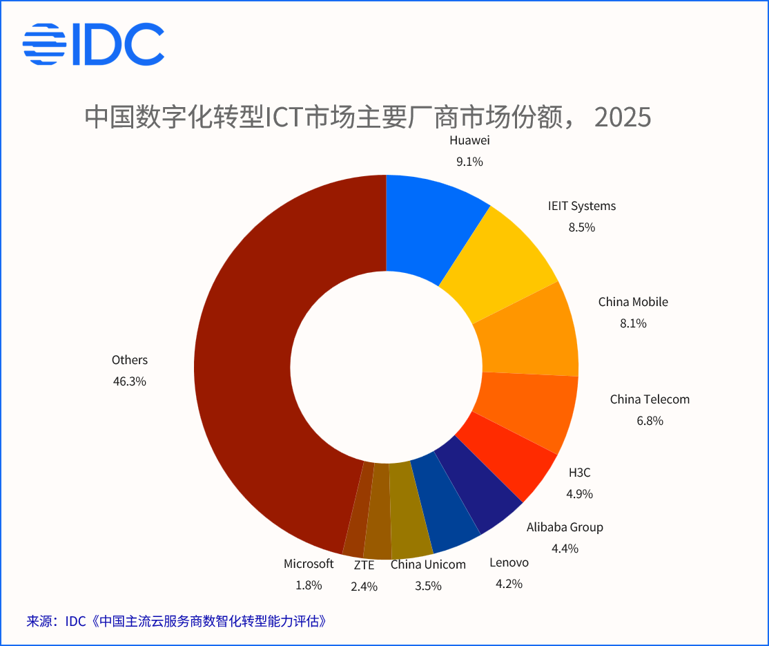
生成式 AI 正在重塑中国数字化转型 ICT 市场的增长底色。国际数据公司( IDC) 最新完成的 2025 年度市场份额追踪研究显示,中国数字化转型 ICT 市场整体实现较快发展,市场规模达到1879.5 亿美元,同比增长 25.0%。企业数字化的重心,已经从基础上云迁移,转向业务层面的智能化重构。算力基础设施、AI 增强软件、数字化实施与托管服务共同构成市场主要增长动力。市场参与者表现出明显分化,同时市场仍存在大量分散的细分机会。本文基于本次份额研究的观测,分享我们对市场变化的客观研判。

AI 成为大盘核心引擎,市场参与者增长加速分化

本次 IDC 研究覆盖完整的数字化转型 ICT 市场,包含硬件(IaaS、企业级硬件、终端设备)、软件(基础设施软件、应用开发部署软件、应用软件)、ICT 服务(商业服务、连接服务、IT 服务),统计口径为厂商面向企业数字化转型的相关交付收入,剔除消费电子类业务。

从竞争格局上看,市场并未形成寡头垄断,各家厂商依托自身资源禀赋与赛道布局取得不同的市场表现。部分厂商抓住 AI 算力、行业智能化的发展机遇实现较快增长;也有不少存量市场参与者保持稳健的基本盘,增速与大盘存在差距。值得我们重点关注的是,大量市场体量分散在众多中小服务商群体当中,下沉市场、垂直细分场景依旧存在广阔空间,行业未来存在整合演进的可能性。

不同厂商之间的增速差异,折射出赛道红利的转移——聚焦算力基建、算网融合、行业智能化落地的厂商增长表现更为突出;而以传统存量业务为基本盘的厂商,增长节奏相对平缓。我们也看到,部分厂商凭借算力硬件交付能力实现收入快速提升;运营商群体依靠广泛的属地服务网络守住基础市场;云服务商、通用软件厂商则依托各自产品生态服务目标客户圈层。

六大市场变化重塑数字化 ICT 竞争规则

我们可以看到, 2025 年出现多项结构性市场变化,正在潜移默化改变行业的竞争逻辑。

  • 增长逻辑由基建扩容转向 AI 价值落地。

市场预算重心从一次性硬件资本支出,向软件订阅、模型调优、场景实施、智能运营这类持续性服务转移,单纯硬件交付的增长天花板逐步显现。

  • 采购模式从单品采购走向一体化总包。

客户越来越倾向于选择 “算力底座‑软件平台‑行业场景‑落地服务” 的整体解决方案,单独售卖硬件、软件或者服务的模式竞争力持续减弱。

  • 客户需求两极分化特征加剧。

大型客户追求深度定制、全栈能力与长期运营;中小企业、县域市场更偏好轻量化 SaaS 与托管算力,单一产品体系很难覆盖全部客户群体。

  • 算网融合打开新型基建增量空间。

以毫秒级算力调度、边缘算力为代表的算网项目不断落地,市场边界从传统中心数据中心,拓展到中心‑边缘‑终端协同的全域算力网络。

  • 价值重心持续向软件和服务迁移。

硬件逐步回归基础设施属性,面临毛利承压;AI 行业应用、数据治理、数字化运营等高附加值业务,成为厂商获取溢价的核心来源。

  • 生态协同成为项目交付的必备能力。

大型数字化项目复杂度持续提升,单打独斗模式难以为继,联合生态伙伴完成交付已经成为行业常态。

行动建议

  • 拓展 AI 场景化能力,对冲硬件业务周期性风险。

算力硬件的市场红利带有明显周期属性,如果业务高度依赖硬件项目集采,中长期将面临增速回落与价格竞争压力。硬件与基建类供应商,应当利用现有客户基础,向 AI 应用适配、模型部署、算力调度等服务延伸,把一次性设备销售,转化为可长期续费的软件与服务收入,构建更抗周期的业务组合。

  • 深耕重点垂直行业,打造难以复制的场景竞争力。

市面上通用 ICT 方案的同质化竞争已经愈发激烈,泛行业铺开的模式很难建立差异化优势。建议厂商收敛赛道,选择 1‑2 个重点垂直领域深耕,吃透行业业务流程与现实痛点,沉淀适配行业的解决方案。行业场景能力是打开高端政企市场、改善项目毛利的重要抓手。

  • 搭建分层产品矩阵,适配不同层级客户诉求。

当前市场客户需求差异巨大,一套产品很难兼顾全部市场。面向大型政企客户,需要具备深度定制、全栈交付、长期运营的能力;而面向中小微以及县域客户,则需要输出轻量化、高性价比、开箱可用的 SaaS 与托管算力产品。通过分层的产品与服务,避免出现高端做不透、低端打不动的两难局面。

  • 把握长尾市场机遇,提前布局行业整合窗口。

市场接近半数规模由大量中小服务商所贡献,未来几年行业洗牌会持续发生。头部及中坚厂商可以借助自身技术、交付能力,通过轻量化产品输出、生态合作等方式触达细分行业与县域市场,抢占长尾市场份额,巩固中长期市场地位。

  • 推进方案模块化沉淀,控制定制项目交付成本。

大量政企项目存在高度定制化特征,容易带来交付成本高、复制难度大的问题。厂商需要持续从落地项目中沉淀可复用的模块、模板,采用 “标准化底座加少量定制开发” 模式,平衡客户个性化诉求与规模化交付效率,改善项目盈利水平。

  • 保持技术迭代节奏,同时做好内部财务风险管控。

AI 技术迭代速度快,需要持续投入以维持产品竞争力。与此同时,ICT 项目普遍存在周期长、回款节奏不确定的现实问题,企业需要完善项目成本、回款管理机制,强化现金流健康度,在技术投入与经营安全之间取得平衡,保障业务稳健运转。

  • 打造标杆实践,强化行业层面的品牌公信力。

政企客户选型高度看重真实落地案例的参考价值。厂商应当集中资源打造可复现、可展示的标杆项目,沉淀完整落地方法论。依托标杆项目建立行业认知,提升在重点赛道的获客能力与行业话语权。

IDC分析师展望与观点

综合 2025 年市场数据与产业走访,25.0% 的年度高增速来自 AI 算力阶段性投资拉动,预计未来 1‑2 年市场增速将至稳健区间。增长动力将由硬件资本开支逐步转向 AI 应用、数据治理与数字化运营服务;行业竞争不再单纯以营收规模作为评判标准,算力底座、行业场景能力以及全周期交付服务的综合实力愈发关键,市场头部存在份额向上集中的趋势,但整体市场仍保持较高分散度,未来两到三年行业集中度有望抬升,具备生态与场景沉淀能力的参与者将更占优势,而缺少差异化壁垒的服务商将承压,同时产业走向仍会受宏观环境、技术迭代等多重变量影响,供应商不宜追逐短期硬件红利,应当回归为客户创造实际业务价值的核心逻辑,以此巩固自身市场地位。

IDC《中国数智化转型报告》帮助技术买家和技术提供商更好地了解政府相关政策以及业务和技术发展趋势,深入了解数字转型支出增长和数字业务,以及人工智能生态系统的变化,掌握数字业务和AI转型的用例和路线图,并了解跨行业或同行的最佳实践。

IDC《中国数智化转型报告》相关研究:
《中国主流云服务商数智化转型能力评估》

《中国数字化转型市场预测,2026—2030》

《中国AI驱动的业务创新之厂商实践系列报告-2026》

《从Token消耗到日活智能体数(DAA)产出:智能经济时代企业AI价值的新度量衡》

进一步交流:

本文数据及观点均源自IDC《中国数字化转型ICT市场份额,2025》。如需获取细分市场(硬件、软件、ICT服务)的份额数据、重点厂商增长归因分析、垂直行业与区域市场的定制化研判,或就本文提出的六大市场变化与行动建议做进一步探讨,欢迎联络IDC中国数字化转型研究团队。请点击此处与我们联系。

Nicholas Guo

Nicholas Guo - Senior Research Manager

Nicholas Guo is a senior research manager in IDC China, responsible for research and analysis of the entire China ICT market. His primary focus is on the overall China ICT market trends covering enterprise-level hardware, software, and services, and ICT…

In October 2024, IDC FutureScape: Worldwide Future of Work 2025 Predictions forecast that by 2026, organizations relying exclusively on command-and-control leadership would see a 20% drop in profitability because of a lack of AI innovation and adaptability. Two years later, Amy Loomis, Group Vice President, Workplace Solutions at IDC, has tested the idea behind it against IDC’s own survey data.

The survey measured AI returns, not profit, so it does not confirm the 20% figure directly. What it does show is a clear gap in how leaders and laggards approach AI, and it starts with what they do with the time AI frees up.


Why did IDC predict a 20% drop for command-and-control leadership?

Loomis defines command and control as strategic decisions made by senior management with little or no input from workers, a fully top-down model. IDC made the prediction because more than half of the companies investing in generative AI at the time said it was disrupting their business. Treating AI like a standard technology rollout, she says, would bring surprises.

The more successful companies took a different path. They gave employees a say through pilots and experimentation, and they collected feedback, which let adoption move faster.

“

It can’t just be all about the tech and how it magically makes things better.


— Amy Loomis, Group Vice President, Workplace Solutions at IDC

Did the prediction hold?

Two years on, Loomis wanted to see whether that pattern showed up in the data. She put the prediction to a test by splitting IDC’s Future of Work survey by the ROI organizations reported on their AI investments. About 15% of respondents were leaders, with an ROI of 50% or higher (174 of roughly 1,145). Another 38% were achievers, working their way up, and 47% were laggards, with no ROI or no tracking yet.

Loomis is careful about what the split shows. Command-and-control organizations are not simply unprofitable, she says. Chasing the low-hanging fruit that can be made more efficient at the outset gives them false momentum, and they can “win the battle and lose the war” if no one looks at the long-term impact on the organization.

What separates AI leaders from laggards?

The gap between the groups starts with what organizations do once AI makes them more efficient. Loomis explains that leaders asked what to do with the free time that efficiency creates. They could have raised the bottom line or cut headcount, and laggards predominantly focused on profitability and efficiency. Although she says profitability and innovation do not have to be in opposition, leaders redirected the time into new work practices and more innovative products.

That emphasis extended to people. Leaders invested across the whole life cycle, including entry-level employees, so every level was upskilled with the same tools. She points out that agentic work requires the whole workforce, and the survey gaps she describes show how far apart the groups are:

  • A balanced approach that includes every level of the organization: 45% of leaders versus 25% of organizations seeing no ROI.
  • A fully operational center of excellence with collective governance: 63% of leaders versus 15% of laggards.
  • 78% of leaders could point to a concrete measure of the relationship between employee experience and customer experience over the past 12 months, compared with 29% of laggards.
  • Leaders were also more than 10 percentage points likelier than laggards to be building new roles for agentic AI.

The metrics they track point the same direction. Productivity scores ranked near the top for organizations working toward high profitability. Leaders ranked lowest on that measure and highest on skills proficiency and teaming behavior, which Loomis reads as a long view that aligns the people side of the equation with the technology side.

Why does stronger governance bring more AI freedom?

The center of excellence gap points to a pattern: companies with the most formal AI oversight also give AI the most freedom. Loomis describes a balance: strict guardrails cover deterministic functions, such as preventing identity fraud and prompt injection. Inside those limits, leaders leave space for innovation. They pair human or AI governance with rising levels of AI autonomy.

When trusted people and processes sit alongside IT guardrails, she says, organizations can give AI more autonomous purview in a gated, guarded way and innovate at scale. That takes calibration and repeated testing, because hallucinations are real and managers vary in quality. It also depends on collecting the right data to measure. IT holds a primary role in that governance, she adds, alongside collective decision-making across functions.

Will command-and-control models keep declining?

Loomis does not expect command and control to fade in a direct, linear way as AI spreads. Boards are pressing leaders for results and bottom-line growth, and she describes the mood as full speed ahead. She expects spurts of command and control to complete specific tasks or initiatives.

Over time, she is fairly confident, a more moderated, federated model will become the key to success. Organizations that show they can grow at speed and scale by investing in people and governance with a long-term view will, she expects, set new standards of leadership. Those standards could be adopted much as command and control became the standard for the industrial era.

What should leaders watch next?

The emphasis on measuring the right things carries into her 2027 research. Loomis notes that her FutureScape 2027: Human-Agent Workforce Strategy predictions focus on the how of the shift. Organizations will need to measure, monitor, and manage the relationship between human workers and agents, which she calls a cornerstone of 2027 planning.

She also points to how people learn and share skills, and how new entrants prepare for agentic ways of working, which she calls a work in progress. Loomis describes the work as balancing AI as a tool with AI as a component of how work gets done and how success is measured. Tokenization is on the list too: weighing the whole investment against the whole return from these tools.

The takeaway: pair your AI strategy with an organizational plan

Those 2027 questions build on what leaders are already doing. Loomis adds that every technical adoption strategy needs an organizational parallel, and in the survey, leaders paired the two. They were likelier to create new roles and redesign human and AI roles in the same exercise, and they retrained and upskilled far more than others.

Leaders also connected functions. They asked how those functions link, such as internal ERP data and external CRM data, or accounting and HCM applications. AI suits those interconnected workflows well, Loomis says, so a practical starting point is to map where functions that often operate in isolation depend on each other, alongside a plan for the roles and skills involved.

Christina Cardoza - Content Marketing Manager - IDC

Christina Cardoza is a Content Marketing Manager at IDC, where she specializes in brand content and social media strategy. With a background in journalism and editorial leadership, she has a proven ability to transform complex technology topics into clear, actionable insights.

On November 12, 2026, Jensen Huang, the cofounder of NVIDIA, resigned as President, CEO, and board member, effective immediately. NVIDIA’s board moved quickly to allay perceived market uncertainty by appointing the company’s CFO, Colette Kress, as interim CEO while it seeks a long-term successor. IDC sees near-term AI infrastructure demand and supply as largely locked in, so the harder questions sit further out: long-term bets on emerging technologies (e.g.., quantum computing),  road map decisions across consumer and infrastructure products, ecosystem expansion and financing, and customer relationships that ran through Huang personally.

What has NVIDIA publicly confirmed about Huang’s departure?

NVIDIA has confirmed that Huang resigned as President, CEO, and board member, effective immediately, and gave no reason.. The board moved quickly to remove his mentions from the company website. CFO Colette Kress was named interim CEO and will keep the CFO role until a permanent CEO is named. The company also named Harvey C. Jones the first-ever Board Chair. It expects operations, customer commitments, and the road map to continue without interruption.

In the meantime, the company said it will continue its search for a long-term replacement and is reviewing internal and external candidates. NVIDIA has not given a timeline for the search, a short list, or any word on whether Kress is a candidate. It is also unclear who owns road map and partner decisions day to day. The first test of the continuity message comes November 17, when NVIDIA reports Q3 FY27 results for the quarter ending October 2026.

Executive-level searches of this importance often run for months. A permanent CEO named before or shortly after the earnings call would be a strong stabilizing signal, though that may not be feasible. IDC will not speculate on potential candidates and does not comment on allegations or personal matters.

Does Huang’s exit change AI infrastructure demand or supply in the near term?

 Not materially in the next few quarters, in IDC’s view. Hyperscaler and AI cloud demand is running ahead of supply, and memory, packaging, and power constraints, not sentiment, limit how fast the market can move. IDC does not expect relief in memory supply before 2028. In August, NVIDIA guided fiscal Q3 revenue to $108 billion, plus or minus 2%, with no datacenter compute revenue from China assumed. Customer commitments and supply are locked in well ahead.

Most large buyers are supply-constrained and have committed capacity, so a near-term pause or re-sourcing of orders is unlikely. Some will ask for a second-source plan and written allocation commitments. IDC considers that prudent, and believes that is a slower-moving change than the headlines suggest.

Where does the leadership risk sit?

IDC sees leadership risk as a medium-term issue. The first-order test is whether road map cadence, partner commitments, and customer allocation hold over the next two to four quarters. Huang was the connective tissue. He personally anchored relationships with service providers and OEMs, the pace of NVIDIA’s ecosystem investments, and a very flat management structure. An interim, finance-led leadership team will be tested in each of those areas.

History is mixed when it comes to sudden departures of long-term founders/co-founders at a company. For example, after Steve Jobs, Apple had a clear successor and thrived. HP and Intel saw abrupt exits without ready successors and struggled afterward. NVIDIA’s situation is arguably less certain because the founder’s influence is so broad and no successor was publicly named.

As a stabilizing step, Kress knows the company’s commitments and customer terms better than almost anyone. We believe she will delegate product, partner, and ecosystem calls to her immediate direct reports, who will cascade them to the rest of the organization. This will no doubt have an empowering effect on senior leadership who may see this as a growth opportunity.

IDC has no evidence of a change to the road map, including Vera Rubin, and what comes after it. The architecture work is well advanced, and the engineering organization is mature and on a solid footing. The risk sits in the cadence and ambition of the generation after that, which depends on strategic judgment at the top.

Which part of NVIDIA’s business deserves the closest watch?

Ecosystem financing. NVIDIA’s supply and capacity commitments rose from $119 billion to $279 billion last quarter, largely reflecting memory, and it has extended guarantees and equity investments to help customers finance capacity. Much of that was driven from the top. A new leader may keep it, trim it, or restructure it.

The same goes for long-term bets Jensen made on nascent or emerging technologies. For example, Jensen made a bet on quantum computing. At last year’s GTC, he convened a summit of CEOs from quantum computing startups, admitting that the technology was real and someday could pose a threat to NVIDIA’s business.

Will AMD, Google, or custom silicon take share from NVIDIA?

Possibly, though it will be gradual. IDC estimates NVIDIA holds more than 80% of 2026 datacenter accelerated server revenue. AMD is in the low single digits, and its rack-scale platform is not expected to change share this year. AMD is the clearest merchant-silicon alternative, and cloud service provider custom silicon-based services are scaling quickly. Competitors such as AMD, Google, AWS, Oracle, Microsoft and others that compete with NVIDIA will gain by winning incremental spend in a fast-growing market, not by displacing installed NVIDIA-silicon-based systems. A key marker will be how NVIDIA’s OEM partners respond. Dell, HPE, Lenovo, and Supermicro ship NVIDIA-based rack-scale systems and would be among the first to hear whether customers start asking for alternatives.

Is China a demand risk or a policy risk?

IDC treats China as a policy variable. NVIDIA’s guidance already assumes no datacenter compute revenue from China, so direct revenue exposure is limited. The larger issue is media reporting that alleges chips may have reached China through indirect means. IDC will continue to monitor this situation through our supply chain intelligence channels. IDC does not publicly comment on or speculate about allegations or ongoing investigations. Our focus here is the business and market implications.

What should enterprise buyers do now?

Do not change plans based on this news alone. IDC recommends three steps. First, confirm allocation, lead times, and support terms in writing. This should be part of your supply chain due diligence anyway. Second, add an alternative platform to your qualification plan. It is good to have a diversification plan. Third, revisit when NVIDIA reports and names a permanent CEO. Crucially, watch for signals such as what comes after the CEO has been named, the ensuing executive-level changes, and updates to the company’s roadmaps.

For media inquiries visit the IDC Press Room or email press@idc.com.

Ashish Nadkarni - GVP/GM, Infrastructure Research - IDC

Ashish Nadkarni is Group Vice President and General Manager within IDC's worldwide infrastructure research organization. Ashish oversees seven global research practices: infrastructure software platforms, cloud and edge services, storage and converged systems, performance intensive computing, compute infrastructure and service provider trends, enterprise and emerging workloads, and the future of digital infrastructure. Additionally, he oversees two regional research practices: Canadian infrastructure solutions, and Latin America enterprise infrastructure and cloud services. Ashish and his team also curate BuyerView, an industry leading portfolio of primary research products that provide a voice of the IT buyer on technology and services adoption trends including cloud and edge services, artificial intelligence (AI), high performance computing (HPC), security and networking, xOps, and software development.

Jeff Janukowicz - Research Vice President, Solid State Drives and Enabling Technologies - IDC

Jeff Janukowicz is a Research Vice President at IDC where he provides insight and analysis on the SSD market for the Client PC, Enterprise Data Center, and Cloud market segments. In this role, Jeff provides expert opinion, in-depth market research, and strategic analysis on the dynamics, trends, and opportunities facing the industry. His research includes market forecasts, market share reports, and technology trends of clients, investor, suppliers, and manufacturers.

Matt Eastwood - Senior Vice President, Enterprise Infrastructure & Cloud, Security & Trust, and IT Operations & Application Development - IDC

Matt Eastwood leads IDC’s worldwide research across enterprise infrastructure and cloud, security and trust, and IT operations and application development. His team helps technology suppliers, buyers, and investors understand market opportunities, evaluate emerging technologies, and make informed investment and operating decisions.

A client contacted me recently, a few weeks before they renewed a datacenter colocation contract they had held for six years. They planned the usual way: last year’s rate, plus a small uplift for inflation. Their provider’s opening offer came back almost 20% higher. The client had not leased more racks. The provider had repriced around power, and the client had not asked about it.

The market has flipped

For close to fifteen years, colocation prices largely moved one way: down. That has reversed, and IDC’s research shows prices up 17% over the last five years. AI is the cause, and so is the fight for the power to run it. IDC’s latest forecast puts worldwide colocation revenue at $61.0 billion in 2025, growing to $99.6 billion by 2030, a 10.3% annual growth rate. Asia/Pacific and Latin America are among the fastest-growing regions, at 12.5% and 14.1% a year, as AI-ready capacity attracts a growing share of investment.

Olga Yashkova, an IDC Research Manager covering this market, put it this way:

“

The colocation market has moved past its growth-story phase into something closer to a supply crisis… Providers that can secure power and execute fast are commanding real pricing power for the first time in over a decade.


— Olga Yashkova, Senior Research Manager, Enterprise Networks, IDC

The numbers back her up. U.S. colocation capacity grew 48% in a year, yet only 1.2% sits empty. Vacancy in Northern Virginia, the world’s largest colocation hub, hit 0.3% in early 2026. Atlanta hit 1%. Both are historic lows, and in my experience, these vacancy levels reduce a provider’s willingness to negotiate.

It’s kilowatts now, not cabinets

Buyers used to count the racks they needed and ask for a per-rack rate. That approach assumed power was a given, quietly bundled into the price of space.

Average rack power demand has climbed from 4-10 kW to 20-40 kW today, and every increase in density needs more cooling and more electrical infrastructure. Providers are planning 60-100 kW racks within two years, and some installations already exceed 200 kW.

IDC research projects a U.S. power shortfall of around 45 GW by 2028. Nearly 7 GW of planned 2026 U.S. capacity has already been delayed or canceled because of a lack of power. Providers are now building their own supply, and the largest cloud companies have signed 13 nuclear deals totaling more than 9.8 GW of capacity. Construction costs, which show up at your next renewal, have also risen from around $8 million per megawatt to $11.5-$12 million today.

What IDC benchmarks show

This is consistent with our most recent market price guidance, published in September 2026, which covers 51 markets worldwide. When we price in dollars per kilowatt, the differences between markets become clear.

MarketRegionMonthly price per kW
MontrealNorth America$107-$157
DubaiMiddle East & Africa$165-$228
Northern VirginiaNorth America$195-$240
FrankfurtEurope$238-$268
SingaporeAsia/Pacific$335-$480

Tier III wholesale asking rates for 250-500 kW requirements. Power pass-through charges, cross-connects, remote hands, and bandwidth are excluded.

 Singapore costs roughly three times as much as a power-advantaged market such as Montreal, a gap a per-rack quote would not show you.

Certainty has a price, too

Some large buyers are making a different choice. A global financial markets operator I advise is negotiating its next colocation contracts on a fully allocated, all-in basis. They pay a flat rate that already includes the provider’s margin and risk premium, instead of paying for what they use. It is the more expensive path (at least in the near term), but they are choosing it anyway, for around three years of price certainty. The alternative is a metered structure tied to real cost drivers, where your bill will move with the market.

 What to ask for, and what to do with it

Most of the quotes we benchmark lack the information buyers need because providers rarely volunteer it. Ask for the following:

  • Facility tier. Get Tier III or Tier IV in writing. Ask for Uptime Institute’s “Constructed Facility” certification, since design documents alone don’t confirm it.
  • Power. Get the figure in kW. If the provider quotes kVA, ask for the power factor too. Without it, the conversion will be wrong.
  • Pricing basis. Find out whether the rate is all-in or metered. If it is all-in, check whether cooling and power are included or billed separately.
  • Escalation. Are increases fixed or tied to CPI or RPI, and when does the first increase apply?
  • Term. The contract term, checked against any ramp schedule or step-down, and any free period.
  • One-off charges. Get every one-off charge up front, including installation, plus fit-out and customization work.
  • Utility rate and PUE. Ask for both, if the provider will share them.
  • What the rate includes. Confirm exactly what you get: space, power, cooling, security, cross-connects, bandwidth, and remote hands.
  • Market and validity. Confirm the market so you can compare against the right benchmark, and check the quote’s validity date.

With this in hand, benchmark in dollars per kilowatt, not dollars per rack. Weigh the premium of a primary hub, such as Northern Virginia or Frankfurt, against a secondary market. Then decide deliberately whether you want metered exposure or fully allocated certainty.

The bottom line

Your provider has already repriced around power. They know their construction costs and their position in the grid queue. They also know how much leverage a 0.3% vacancy rate in Northern Virginia gives them. Most buyers still walk into a renewal, compare this year’s quote with last year’s, and call that preparation. In my view, the old colocation price is not coming back. The buyers who hold their ground bring an independent, power-normalized benchmark to the table before the conversation starts.

If you are approaching a datacenter colocation renewal, contact the IDC benchmarking team or me to discuss a power-normalized review before you negotiate.

Tom Collins - Research Director of Global IT Sourcing & Benchmarking - IDC

Tom Collins is IDC's Research Director of Global IT Sourcing & Benchmarking, advising organizations on IT cost management, sourcing strategy, and technology procurement.

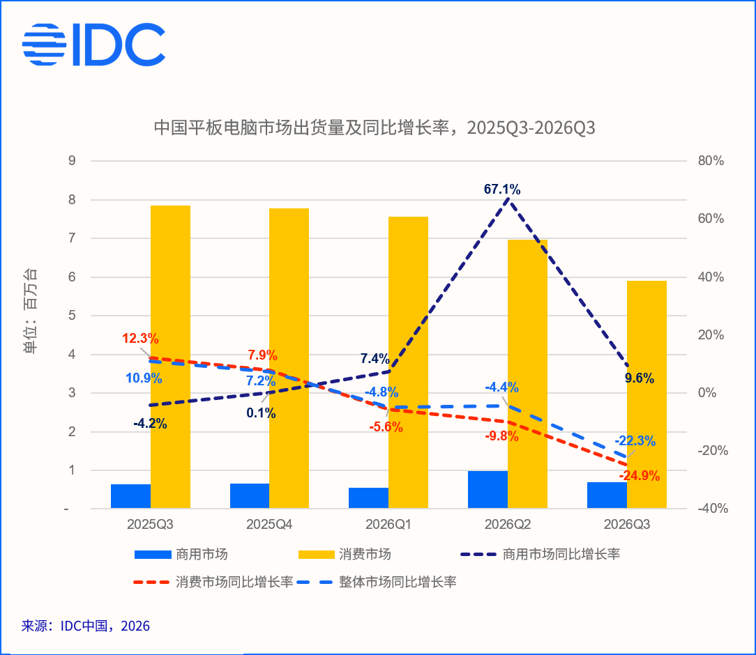
第三季度中国平板市场出货量同比下降22.3%,成本压力加速向需求端传导,市场调整幅度进一步扩大。消费市场受涨价影响持续收缩,商用市场则在需求前置后逐步回归常态,厂商竞争及市场需求结构也随之发生变化。

国际数据公司(IDC)发布了2026年第三季度中国平板电脑市场季度跟踪报告。数据显示,2026年第三季度,中国平板电脑市场出货量为660万台,同比下降22.3%。伴随成本上涨压力充分向销售端传导,市场出货量降幅较上半年显著扩大,单季度出货量在连续12个季度后首次低于700万台,降幅也创下2020年第一季度新冠疫情以来的最大值,市场首次迎来同比双位数下滑。

从市场表现来看,第三季度有三个值得关注的变化:一是消费与商用市场的表现背离仍在延续,但商用市场增长恐难持续;二是头部厂商格局相对稳定,中游厂商份额继续提升;三是成本上涨推动市场需求加速分化,入门级市场收缩与中高价位段升级同步发生。

消费市场涨价导致销量折损,商用市场库存补充进入尾声

2026年第三季度,中国消费与商用平板市场出货量继续呈现背离趋势。消费平板出货量同比下降24.9%,伴随头部厂商接连上调产品售价,市场均价环比提升8.6%,价格上涨对消费者购买意愿的抑制进一步显现。

商用平板市场出货量同比增长9.6%。作为教育行业需求高峰期,7、8月厂商继续加码教育市场布局,但9月需求已明显减弱。与此同时,华为、荣耀自7月起上调商用平板售价,也对后续市场需求带来压力。随着前期需求前置及渠道库存补充逐步进入尾声,商用市场增长势头预计难以延续。

竞争格局稳中有变,厂商持续调整产品布局以缓和涨价压力、寻求增长轨道

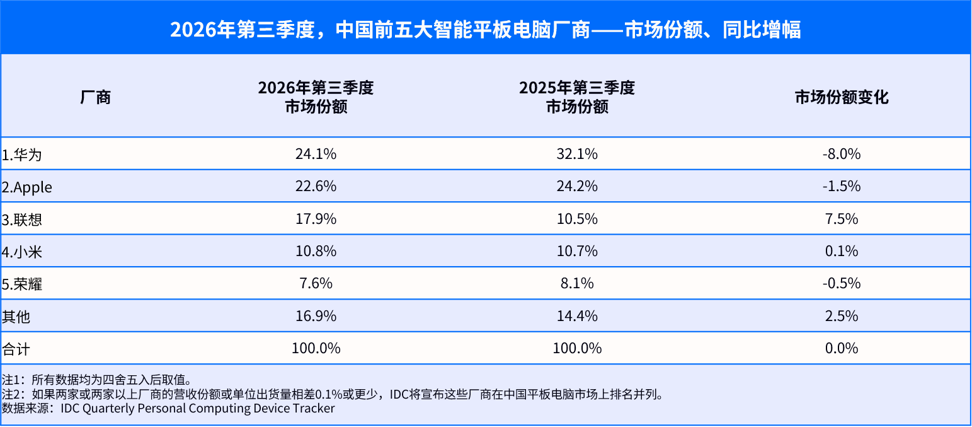
2026年第三季度,中国平板市场前五厂商排名与上一季度保持一致,但中游集团市场份额继续提升。成本上涨背景下,厂商在产品结构、渠道布局及价格调整节奏上的差异进一步显现。

  • 华为继续位列市场第一。尽管其消费及商用平板均迎来较大幅度的价格上调,但凭借鸿蒙生态互联能力、品牌影响力及完善的渠道布局,华为仍保持市场领导地位。与此同时,华为平板产品迭代持续推进,接续产品配置较上一代明显升级,带动产品结构优化。
  • Apple位列市场第二。6月底Apple上调其平板产品售价,导致第三季度出货量同比下降27.2%。价格上涨削弱Apple平板的竞争力,市场规模承压的同时,其产品结构也明显向低价数字版机型倾斜。
  • 联想位列市场第三,出货量同比增长33.2%,是前五厂商中唯一实现增长的厂商。消费市场方面,小新系列保持性价比优势的同时拯救者系列快速发展,第三季度出货量占比接近半数;商用市场出货节奏相对稳定,价格优势逐步回归,市场份额升至第一。
  • 小米位列市场第四。伴随平板9系列新品上市,小米市场份额企稳回升。其中,小米平板9 Pro Max凭借自研芯片玄戒O3首发优势获得较好的市场反馈,提升品牌声量的同时,也推动了小米平板价位段向上拓展。
  • 荣耀延续市场第五位。消费市场受成本上涨冲击持续收缩,季度新品平板X10 Pro Max凭借价格优势及教育场景拓展,帮助荣耀拓展13英寸及以上大屏市场布局;商用市场则在教育采购高峰期下延续高速增长,并通过配置调整优化产品价格。

市场需求加速分化,入门级市场收缩,中高价位段需求上移

受成本上涨影响,平板产品价格逐步抬升,部分厂商被迫放弃入门级价位区间,千元以下入门级市场规模同比缩减51.4%。与此同时,中高价位段份额持续提升。2026年第三季度,中国平板市场3000元及以上机型出货量占比约为45%,环比提升近10个百分点。

当前背景下,中高价位段需求拓展主要来自两类场景:一是结合大尺寸屏幕及PC级生态迁移的轻办公与学习场景,二是以小尺寸产品为代表的电竞及随行场景。伴随价格持续上涨或盘踞高位,厂商迫切需要通过性能、生态及场景体验提升平板的产品价值,为中高端产品创造更充分的溢价空间。

IDC结论及展望

2026年第三季度,中国平板市场出货量迎来双位数下滑,成本上涨对市场的影响进一步放大。消费市场需求明显收缩,商用市场也逐步进入前期需求释放后的调整阶段,整体市场面临较大压力。

IDC预计,此轮成本压力将持续至2028年,2026年第四季度及2027年中国平板市场出货量规模将面临较大挑战。价格上涨导致消费者换机决策更加谨慎,厂商也需要重新评估产品迭代节奏、市场备货及销售目标,以平稳驶过不确定性较强的市场阶段。

与此同时,市场也将在本轮调整中进一步推动平板产品的场景化布局,围绕核心用户群体挖掘细分需求,加快AI能力与实际应用场景的融合,持续提升平板产品的价值定位,为后续市场复苏与增长拓展新的空间。

进一步交流

本文数据及观点均源自IDC《中国平板电脑市场季度跟踪报告,2026Q3》。如需了解细分价位段、渠道库存、行业垂直场景等详细数据,或针对特定厂商策略进行定制化分析,敬请联络IDC中国终端系统研究团队。请点击此处与我们联系。

Quorra Liu

Quorra Liu - Research Manager

Quorra Liu is a Research Manager for the Client Systems Research team at IDC China. She is responsible for China's smart home device research. Her responsibilities include tracking the monthly and quarterly market development, conducting research in fully managed services market,…

大模型技术的快速演进正在重构 AI 产业生态:在催生 MaaS 等新兴市场的同时,亦为计算机视觉、语音语义、机器学习平台等传统AI赛道创造了新的需求场景与增长动能。

国际数据公司(IDC)于近日发布了《中国AI软件市场半年度追踪,26H1》报告。研究显示,大模型正在以不同方式影响各细分市场:

  • 在计算机视觉领域,大模型更多应用于研发流程优化和泛化场景理解,与传统视觉模型形成互补;
  • 在语音语义领域,大模型加速向会议纪要、翻译、智能客服等应用场景渗透,推动产品能力升级;
  • 在机器学习平台领域,企业基于自有数据的大模型训练与推理需求持续释放,推动平台市场稳步扩容,成为新的增长动力。

整体来看,传统 AI 能力作为企业智能化建设的底座,保持稳健发展;大模型的兴起则为既有市场注入新的技术活力与商业机会,开启新一轮增长周期。

计算机视觉市场稳健增长,大模型与专用模型协同发展

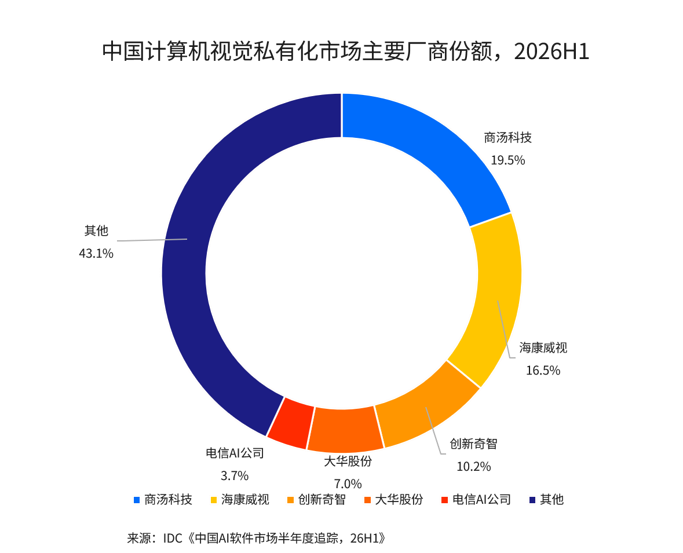
IDC数据显示,2026年上半年,中国计算机视觉私有化市场同比增长16.8%,规模达到43.2亿元。公安、城市治理等领域仍是市场的重要应用场景,视频监控、目标识别、行为分析及城市事件管理等需求持续支撑市场发展。

从技术应用来看,计算机视觉市场仍以专用小模型和传统视觉算法为主。在人脸识别、车辆识别、目标检测、工业质检等对识别精度、响应速度和稳定性要求较高的任务中,经过行业数据训练和场景优化的专用模型仍具备明显的应用价值。尤其在大规模摄像头接入、实时视频流分析等场景中,模型推理效率、算力成本和部署能力仍是项目落地的重要考量。

与此同时,大模型正在为计算机视觉市场带来新的能力增量。一方面,多模态大模型增强了对图像和视频内容的语义理解能力,可以处理传统视觉模型难以覆盖的复杂、开放式任务;另一方面,智能体开始进入视觉AI的研发和业务流程,辅助完成需求理解、数据处理、模型调用及任务编排等工作。

市场格局上,商汤科技以19.5%的市场份额位居第一,依托深厚的视觉算法积累及城市级视觉AI平台能力,在公共安全、城市治理等领域保持领先。其积极推动多模态大模型与专用视觉模型协同,由大模型负责复杂事件理解、分析研判和任务规划,传统模型承担人脸识别、目标检索等专业任务,并开始探索将智能体应用于案件侦查及视觉AI研发流程。海康威视以16.5%的份额位列第二,凭借视频监控领域的硬件与软件整合优势,以及广泛的行业渠道网络,在安防和城市治理领域占据重要地位;创新奇智以10.2%的份额位居第三,聚焦工业视觉质检、产线安全监测等场景,持续拓展制造业应用。

大模型重塑语音语义市场,驱动产品能力升级

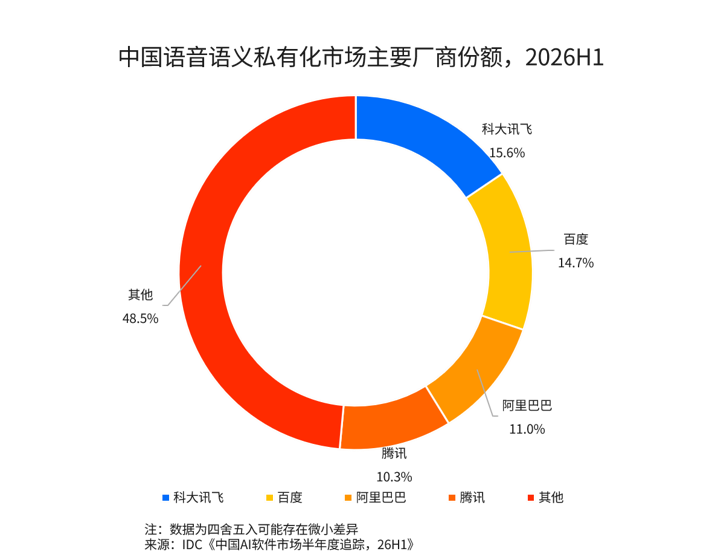
2026年上半年,中国语音语义私有化市场规模达到约62.0亿元,成为大模型技术渗透较为深入的AI私有化市场。

大模型正在推动语音语义能力向更复杂的业务场景延伸。在智能客服领域,应用从传统的关键词匹配、固定问答和语音机器人,向融合企业知识库的多轮对话、坐席辅助和业务流程自动化升级,智能体进一步推动客服从被动应答向主动服务转变。在会议和翻译场景,大模型则推动产品从语音转写向会议摘要、重点提炼和实时跨语言交互延伸。

市场格局上,科大讯飞以15.6%的份额位居第一,依托语音技术积累和星火大模型本地化能力,深耕政务、教育、医疗;百度持续升级语音能力,引入大模型与行业知识库,推动语音交互向智能问答、业务办理和辅助决策延伸,支持政务热线、金融客服等场景的智能化升级,以14.7%的市场份额位列第二。

AI应用公有云市场持续发展,数据治理与利用是大模型落地关键

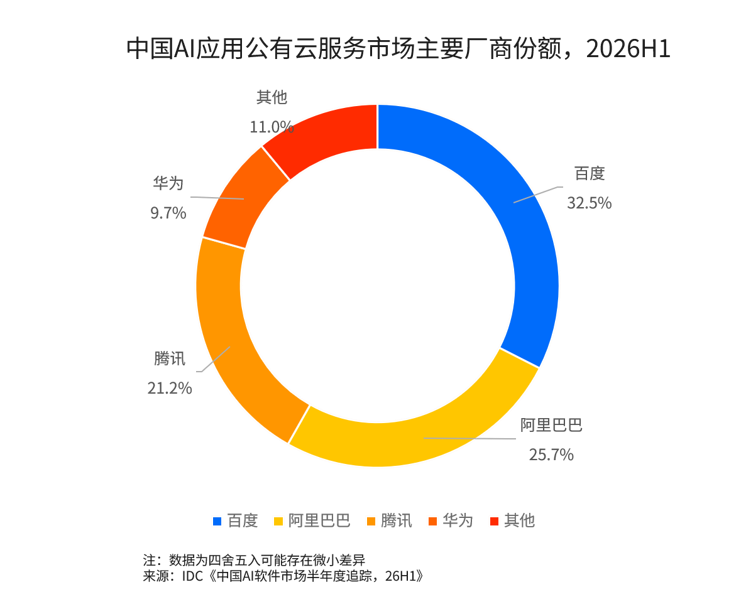
IDC数据显示,2026年上半年,中国AI应用公有云服务市场规模达到67.0亿元。随着大模型加速渗透,AI应用公有云服务的竞争重点不仅强调模型能力本身,更强调对企业业务上下文的理解,以及对数据和知识资产的有效利用。对于厂商而言,产品能力需要从融合大模型能力进一步延伸至理解用户业务流程、连接企业数据与知识库,帮助客户将分散的数据和知识资产转化为可调用的业务能力。对于企业用户而言,大模型应用的效果不仅取决于模型本身,也取决于自身数据治理和知识梳理的成熟度,建立规范、可用、持续更新的数据与知识体系,将成为释放大模型应用价值的重要基础。

市场格局方面,百度以32.5%的市场份额位居第一,持续升级语音与视觉产品,并通过端到端语音大模型、多模态视觉智能体等产品拓展复杂交互和视频理解能力;阿里巴巴以25.7%的份额位列第二,依托通义模型体系,持续丰富语音、音频及图像生成等多模态云服务;腾讯以21.2%的份额位居第三,持续升级语音识别、实时翻译及视觉AI服务,并探索大模型在内容理解和交互场景中的应用。

大模型训练推动机器学习平台市场增长

机器学习平台公有云服务市场:

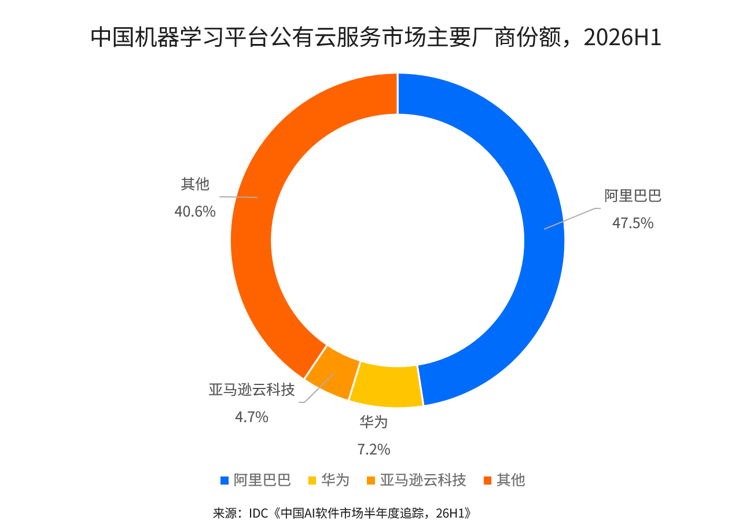
生成式AI应用加速落地、Agent从单轮交互向复杂任务执行演进,以及企业基于自身业务数据开展模型后训练的需求,共同推动机器学习公有云市场持续增长。2026年上半年,中国机器学习平台公有云服务市场规模达到53.0亿元。

从需求侧看,具备数据资源、业务场景和技术积累的头部企业,尤其是互联网、汽车、游戏等行业企业,对模型自主训练和定制化开发的需求更为旺盛,持续加大相关资源投入。从厂商侧看,市场竞争的核心在于算力供给能力与资源利用效率。厂商不仅需要具备高性能、大规模算力集群的供给能力,还需要通过分布式训练、集群调度及训推优化等技术提升算力利用率、降低模型训练成本,从而形成竞争优势。

阿里巴巴依托PAI平台,构建覆盖数据准备、模型训练、微调及推理部署的一站式工具链,并通过灵骏智算集群及训练、推理加速技术,提升大规模训推效率,以47.5%的市场份额保持领先。华为依托昇腾AI芯片及ModelArts平台,构建软硬协同的训推体系,覆盖模型训练、强化学习及推理部署,在大规模集群管理和算力适配方面具备优势。亚马逊云科技依托全球GPU资源,提供大规模模型训练和推理服务,为企业出海提供支持。

机器学习平台私有化市场:

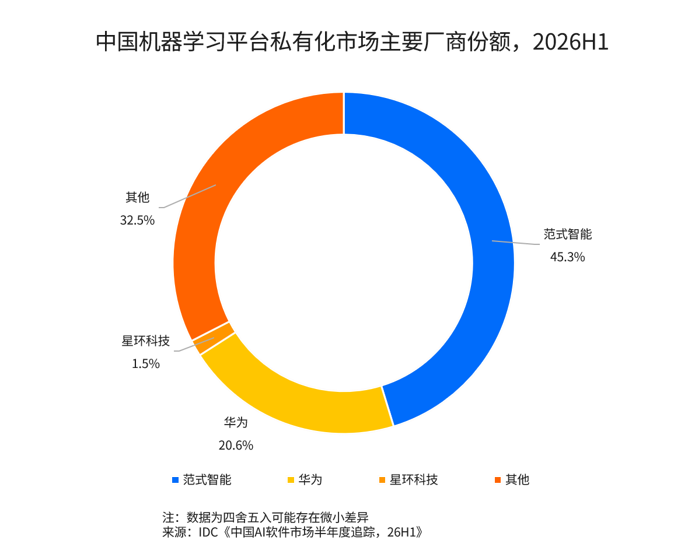
在数据安全与合规要求严苛的金融、政务行业,以及业务逻辑高度定制的零售领域,企业的模型训练与数据应用必须立足自有环境展开,这一刚性约束持续驱动私有化机器学习平台在这些行业的渗透与放量——平台嵌入风控、审批、营销等核心流程后成为常驻基础设施,客户基于它反复训练行业专属模型、持续沉淀可复用的 AI 资产,先发厂商的工程化能力与行业 Know-how 也随交付项目不断累积,构成后来者难以复制的壁垒。在此驱动下,2026年上半年,中国机器学习平台私有化市场规模达到13.0亿元。

市场格局方面,范式智能依托先知 AIOS 平台与 AutoML 核心技术,深耕金融、零售、制造等行业的私有化 AI 落地,以 45.3% 的市场份额位居市场第一。华为聚焦政务、金融、能源等强合规行业的客户,以 20.6% 的份额稳居市场第二。

分析师观点

IDC中国高级分析师洪婉婷表示,随着大模型加速渗透,传统AI市场正迎来新一轮价值重构。大模型并非对传统AI能力的简单替代,而是通过增强复杂场景理解、业务交互和任务编排能力,与专用模型形成互补,拓展AI应用边界。未来,市场竞争将不再局限于单一算法或模型能力,而是更加考验厂商对行业场景的理解、数据与知识资产的整合,以及产品工程化和规模化交付能力。能够将技术优势转化为可持续业务价值的厂商,将在新一轮市场竞争中占据优势。

进一步交流

如希望就《中国AI软件市场半年度追踪,26H1》定义、厂商份额及采购评估框架进一步交流,欢迎与我们联系。

Catherine Hong

Catherine Hong - Senior Market Analyst

Ms. Catherine Hong is served as the role of Senior Market Analyst in Emerging Technology sector for IDC China, and her main responsibility is conducting analysis and research for the China Blockchain market. She is also in support of regional…

Headlines about Europe’s economy rarely mention technology budgets, yet that is where buyers make some of their clearest choices. IDC’s Future Enterprise Resiliency and Spending (FERS) surveys show that 64% of Western European IT leaders expect a recession within the next 12 months, and tariff-driven IT cost inflation ranks among their top concerns. Only 41% expect 2026 growth to beat forecasts, compared with 58% of leaders worldwide. There’s one notable exception: AI; in fact, AI projects are the area most protected from budget cuts, and around 64% of European IT leaders have raised their AI budgets.

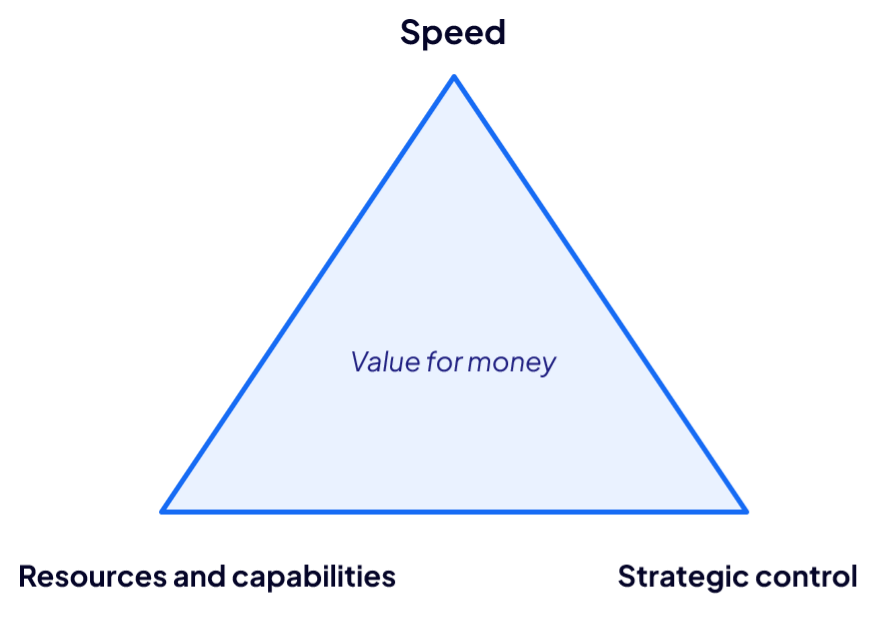
Our upcoming webcast will discuss these pressure points with a strategic framework: the triangle of innovation. Value for money of innovation is realized at the intersection of three variables that IT and business leaders can make decisions on:

  • Resources – Who pays, builds, and runs AI: budget ownership, partner types, skills, and the reasons projects fail.
  • Speed – How quickly organizations move from pilot to production: use of AI, GenAI, agentic AI, and physical AI, and how often projects stall.
  • Strategic control – How much autonomy buyers keep or give up: sovereign AI, the trade-offs they accept, human oversight, and governance at scale.

With infinite resources, one could maximize speed and strategic control; in reality, no organization maximizes all three, so every decision make needs to make practical trade-offs. IDC’s 2026 AI Business Trends Survey of 673 EMEA organizations shows that those decisions differ from one industry to the next.

Start with resources. Across EMEA, 59% of organizations had an AI project discontinued, missed, or cut back in the past 24 months, and poor data quality or integration was the most common cause at 38%. Each industry then has its own pain point. Among financial services firms, 41% say the return on investment fell short. Among manufacturers, 48% point to data quality. In energy and utilities, 44% cite low user adoption.

Speed shows the same variety. Manufacturing leads on physical AI[1], meaning AI that directs machines, robots, and sensors, with 33% of manufacturers already running it in production against 24% across EMEA.  At IMTS in September 2026, that shift was easy to see on the show floor. In one demo, fleets of robots were connected and coordinated through a shared software layer instead of being run one by one, which is what turns separate machines into a system. In another, a small cell was building drones, with robots, tooling, and software working as one flexible unit rather than a fixed line. In both, the constraint was less than the machines than the data and software connecting them. Retail faces the same speed question from the customer side: AI moves forward when it improves a personalization, loyalty, or fulfillment metric. Retailers define success in terms of customer-centric outcomes and need to manage risks in terms of customer data protection[2].

Control is where Europe’s priorities stand out. Some 58% of EMEA organizations use sovereign AI, which keeps data, models, and operations under local legal and operational control, for all or critical workflows. Yet only 33% say they could govern hundreds of AI agents with today’s tooling. Governments are the most cautious. In IDC’s July 2026 survey of 69% of national civilian government agencies globally said generative and agentic AI touch 30% or less of their mission-specific tasks, and only 10% automate more than 40%[3]. The trade-offs buyers accept also vary. Manufacturers (41%) and governments (40%) are the most willing to rely on regional or specialist providers to gain sovereignty, while 32% of retailers would pay higher prices for it. Buyer organizations do not accept limited access to innovative capabilities as a trade-off for more sovereign control; at the very least, they demand transparency about when innovative features will become available in more restricted environments.

Technology suppliers that want to differentiate should consider six moves across the triangle. On resources, deliver through integrators and local partners, because European buyers rely on service providers to build and run agents more than their peers worldwide, and start to build packages that align pricing with business success criteria. On speed, help customers fix the data and infrastructure readiness first, so that pilots can be turned into production systems at scale. On control, make governance a product feature, with approval steps, audit trails, and easy override, and offer a choice of sovereign controls across the five layers of the AI stack: Hardware; Infrastructure Operations; Data Management; Implementation & Delivery (encompassing training data sourcing/model development/monitoring & evaluation/ deployment & inferencing); and Ecosystem-delivered AI Assets & Capabilities[4].

In 2027 European demand for AI is holding up while tolerance for ungoverned AI is falling. Join the webcast to see the industry-by-industry data. Register here.


[1] https://my.idc.com/getdoc.jsp?containerId=US54976226

[2] https://my.idc.com/getdoc.jsp?containerId=US54982726

[3] https://my.idc.com/getdoc.jsp?containerId=US54991526

[4] https://my.idc.com/getdoc.jsp?containerId=EUR153902925

Massimiliano Claps

Massimiliano Claps - Research Director

Massimiliano (Max) Claps is the research director for the Worldwide National Government Platforms and Technologies research in IDC's Government Insights practice. In this role, Max provides research and advisory services to technology suppliers and national civilian government senior leaders in…
Gunjan Bassi

Gunjan Bassi - Research Manager

Gunjan Bassi has more than 14 years' experience working in the logistics and transportation sector. Before joining IDC, she worked with Transport Intelligence (Ti), a transportation and logistics research firm based in Bath, England, where she was responsible for vertical…
Ornella Urso

Ornella Urso - Research Director, IDC Retail Insights

Ornella Urso is Head of IDC's Retail Insights team and leads the Customer Experience research group in Europe. Urso conducts market research, industry analysis, and proactively contributes to the definition of thought-leadership at the intersection of businesses priorities and technology…