
Global Smartphone Shipments Fall 7.4% in Q2 2026 as the Memory Crisis Splits the Market in Two, according to IDC
Samsung and Apple gain share at the top while the mass market contracts sharply.
BOSTON, August 28, 2026 – The global smartphone market shrank 7.4 % year-on-year to 276.3 million units in the second quarter of 2026 (2Q26), according to the final historical data from the International Data Corporation (IDC) Worldwide Quarterly Mobile Phone Tracker, The memory crisis continues to disrupt the smartphone market with unprecedented costs and strained supply, with Q2 2026 marking the second quarter of consecutive year-on-year decline.
“Memory costs are up nearly 300% from a year ago, and now account for over 65% of BOM at the low end, making survival increasingly difficult for OEMs with low-end portfolios,” said Nabila Popal, senior research director for Worldwide Consumer Devices, IDC. “Q2 confirms exactly what we predicted: this is not a uniform downturn; memory crisis is favoring premium players and punishing vendors exposed to the low end. For the second consecutive quarter, Apple and Samsung showed resilience as the only two vendors in the Top 5 posting growth. Apple achieved record high Q2 shipments driven by momentum for the iPhone 17 and fear of upcoming price hikes, keeping Apple on track for a record 22% annual share this year. Low-end vendors are doing their best to adjust strategy, cut costs, and shift their portfolios toward higher margin devices; however, the challenge isn’t strategy – it’s creating demand for these traditionally low-end brands at higher price segments. Consumers are increasingly opting for a premium brand when the price gap reduces, and financing is readily available.”
“The second quarter of 2026 brought a widening gap between the top and bottom of the market. Samsung and Apple both grew shipments and widened their lead, lifting their share by 3.2 and 3.9 percentage points, respectively,” said Francisco Jeronimo, vice president for Worldwide Client Devices, IDC. “This memory crisis has split the smartphone market in two. At the top, Apple and Samsung are pulling away, because they secured supply early and sell where memory is a smaller share of the bill of materials (BOM). At the bottom, the vendors exposed to cheap, high-volume devices are absorbing the pain and so are their customers. This is a crisis that rewards scale, supply relationships and a premium mix,” he added.
“The rankings for Xiaomi, OPPO and vivo remained unchanged from last quarter, but the pace of decline accelerated among Chinese vendors, with most large players falling by double digits YoY,” said Kiranjeet Kaur, associate research director for Worldwide Consumer Devices, IDC. “The sub-$200 segment remains a critical volume driver for them, prompting many to repackage older models or fall back on 4G variants to defend this price band while managing other rising costs. Xiaomi once again posted the steepest decline among the top players as it deliberately trims low-end volume to preserve profitability and shift focus toward higher price segments. Huawei stands apart, posting 19.9% YoY growth by holding prices steady in China as the Android competition raised prices, running targeted promotions, leveraging strong brand loyalty in its domestic market, and widening its lineup to cover more of the price spectrum.”
Top 5 Companies, Worldwide Smartphone Shipments, Market Share, and Year-Over-Year Growth, Q2 2026 (Final Historical results, shipments in millions of units)
| Company | 2Q26 Shipments | 2Q26 Market Share | 2Q25 Shipments | 2Q25 Market Share | Year-Over-Year Change |
| Samsung | 62.7 | 22.7% | 58.0 | 19.4% | 8.1% |
| Apple | 55.7 | 20.2% | 48.5 | 16.3% | 14.9% |
| Xiaomi | 31.2 | 11.3% | 42.4 | 14.2% | -26.4% |
| OPPO | 28.9 | 10.5% | 34.9 | 11.7% | -17.1% |
| vivo | 21.2 | 7.7% | 26.3 | 8.8% | -19.6% |
| Others | 76.6 | 27.7% | 88.2 | 29.6% | -13.1% |
| Total | 276.3 | 100.0% | 298.3 | 100.0% | -7.4% |
| Source: IDC Quarterly Mobile Phone Tracker, August 6, 2026 | |||||
Table Notes:
- Company shipments are branded device shipments and exclude OEM sales for all vendors.
- The “Company” represents the current parent company (or holding company) for all brands owned and operated as a subsidiary.
- Figures represent new shipments only and exclude refurbished units.
- *IDC declares a statistical tie in the Smartphone market when there is a difference of one-tenth of one percent (0.1%) or less in the shipment shares among two or more companies.
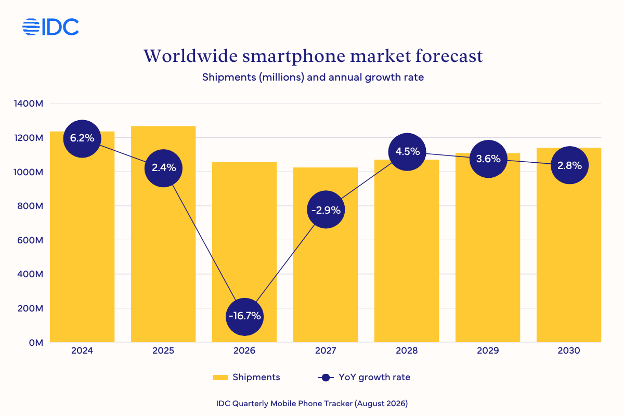
Smartphone Shipments Set for Record 16.7% Drop in 2026, as the memory crisis hits full force
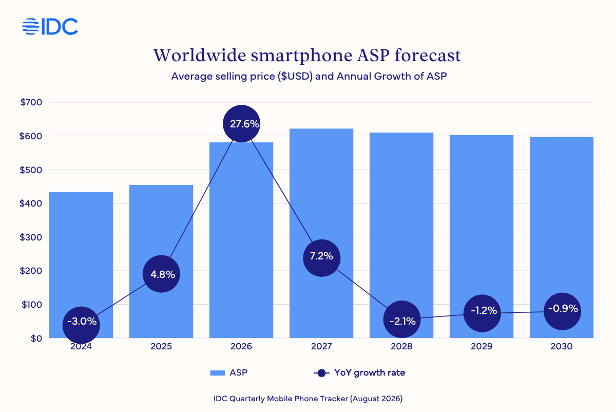
Memory shortage will also cause smartphone ASP to increase 27.6% this year $581. Foldables remain the only silver lining, forecast to grow 12.6% YoY boosted by Apple’s entry into the segment in the second half this year.
The smartphone market has changed character this year. Units are dropping while prices are climbing sharply, with consumers expected to absorb the cost.
According to IDC’s Worldwide Quarterly Mobile Phone Tracker, worldwide smartphone shipments will fall 16.7% in 2026 to just over 1 billion units. That is a sharp downgrade from the 13.9% decline we forecast only one quarter ago, and it is the steepest annual contraction the industry has ever recorded. What makes this moment unusual is that the market is shrinking and getting more valuable at the same time. Total market value will still grow 6.3% to $613 billion, because higher prices are now doing the heavy lifting that volume once did.
Why did the outlook get worse?
The memory shortage, which started in late 2025, is striking hard in the second half of 2026 with shipments forecast to drop by 27.2% YoY. NAND and DRAM costs continue to rise, up over 300% YoY, and vendors are running out of options to absorb the increased costs. As memory prices are expected to continue increasing until at least 2028, vendors are adapting their portfolios to a permanently higher cost structure. The 173 million smartphones below $100 which shipped last year are facing an existential crisis. Android players focused on low-end devices, which were already operating on razor-thin margins, are cutting low-end models and pushing a higher-end product mix. In Q2 2026, this segment saw almost 60% YoY drop and is expected to fall faster in the second half.
How much are smartphone prices expected to increase?
This is where the forecast has moved most. The average selling price of a smartphone will reach $581 in 2026, up 27.6% in a single year and revised upward from the $550 we projected last quarter. More brands are passing the increased cost to the end consumer, with prices rising faster than we expected. The premium end will remain more resilient to the price hikes as long-term interest-free financing options are more prevalent in developed markets like the US and UK. The mass market does not hold up, especially in emerging markets, which are expected to drop over 20% this year. This is why the unit decline continues to deepen while the value line keeps rising.
“The memory tsunami that we warned about is now hitting the market in full, and consumers are starting to pay the AI bill. The components that make AI possible are the same ones in short supply, and their cost is being passed straight through to the shelf. Average selling prices are up 27.6% this year and will keep rising well into 2027. The era of the cheap smartphone has ended. From here, the winners will be the vendors with the scale and supply leverage to hold demand at prices consumers have never had to pay before.”
Francisco Jeronimo, Vice President for Worldwide Client Devices, IDC
Who is winning the crisis, iOS or Android?
The crisis is not hitting everyone equally. Android bears almost the entire decline, falling 24.3% in 2026 as its most exposed vendors retreat from the entry tiers they can no longer serve profitably. Android share drops seven percentage points in a single year. iOS share does the opposite trend, increasing almost four percentage points from last year to record high 23.6% share as shipments remain relatively resilient, down just 1.3% YoY in 2026. HarmonyOS sees strong growth, although coming off a small base, nearly tripling to 51 million units in 2026 as Huawei maintains a disciplined pricing strategy, taking full advantage of the crisis to gain share in China as the rest of the Android market contracts.
Is there any segment that is still growing?
Almost nothing in this forecast grows, except foldables. The category will grow 12.6% in 2026 to 22.9 million units, then accelerate to 18% growth in 2027, reaching roughly 27 million units. The rapid growth is thanks to Apple’s entry into the category in the second half this year. Apple is not only adding a new model or increasing competition in the foldables category; it is converting a segment that was about to decline into the fastest-growing part of the industry.
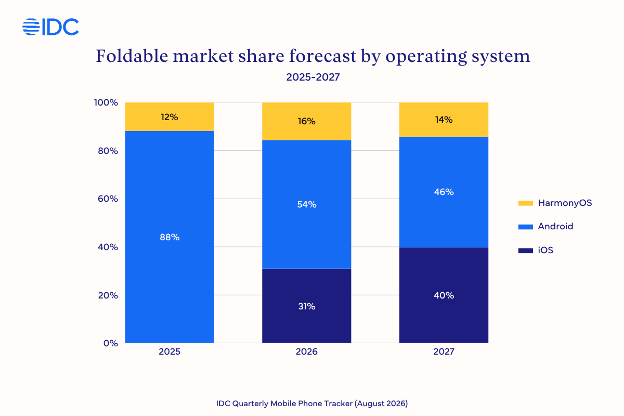
“Apple’s entry into the foldable market has done more than reignite growth in a category that was losing momentum. It has fundamentally altered the market’s trajectory. Without Apple, foldable shipments would have declined at a double-digit rate year over year. We forecast Apple will ship more than 17 million foldable iPhones by 2027, capturing roughly 40% of the global foldables market. With an average selling price exceeding $2,550, Apple is expected to generate more than $45.7 billion in value and account for over half of the category’s total value. Perhaps most notably, Apple is positioned to challenge Huawei and Samsung for leadership in markets where they have long dominated, an extraordinary outcome for a product expected to be less than two years into its lifecycle.”
Nabila Popal, Senior Research Director, IDC Worldwide Quarterly Mobile Phone Tracker
What does this mean for consumers?
The days of cheap smartphone are ending. The average handset now costs roughly $147 more than it did a couple of years ago, and the cheapest models are the ones leaving the shelves fastest. Buyers in price-sensitive markets will feel this loss the most, as the sub-$100 phones many of them relied on are being cut from vendor line-ups. For everyone else it means holding a device for longer and paying more at the point of upgrade. On-device AI is arriving, but the memory it runs on is scarce and expensive, and consumers are covering that cost directly.
What does this mean for vendors?
The next 18 months will separate the vendors who can operate in a structurally more expensive market from those who cannot. Apple, Samsung, and Huawei have the scale and pricing power to turn this challenge to their advantage. Smaller Android brands anchored in the entry tiers face the hardest stretch in the industry’s history, and some will not clear it. The market that emerges on the other side of the crisis, when the memory supply finally stabilizes in 2028, will be smaller in units, larger in value, and far more concentrated at the top. The cheap smartphone era is not pausing. It is over.
About IDC Trackers
IDC Tracker products provide accurate and timely market size, vendor share, and forecasts for hundreds of technology markets from more than 100 countries around the globe. Using proprietary tools and research processes, IDC’s Trackers are updated on a semiannual, quarterly, and monthly basis. Tracker results are delivered to clients in user-friendly Excel deliverables and on-line query tools.
For more information about IDC’s Worldwide Quarterly Mobile Phone Tracker, please contact Jackie Kliem at 508-988-7984 and jkliem@idc.com.
About IDC
International Data Corporation (IDC) is the premier global provider of trusted technology intelligence, advisory services, and events. With more than 1,000 analysts worldwide, IDC offers global, regional, and local expertise on technology, IT benchmarking and sourcing, and industry opportunities and trends in over 100 countries. IDC’s analysis and insights help IT professionals, business executives, and the investment community to make fact-based technology decisions and to achieve their key business objectives. To learn more about IDC, please visit www.idc.com. Follow IDC on X at @IDC and LinkedIn. Subscribe to the IDC Blog for industry news and insights.
All product and company names may be trademarks or registered trademarks of their respective holders.