IDC近期的企业用户调研和交流表明,企业建设和应用智能体时主要面临两个难题:哪些业务场景值得优先投入?项目建成后能否取得可验证的业务成效?

围绕这些问题,IDC通过中国企业级Agent最佳实践与案例精选(ROI)视角这本报告,对中国企业Agent的应用案例进行了深入研究,案例覆盖金融、制造、港口、建筑、贸易、零售、能源、医药和城市治理等场景或行业。报告重点关注Agent进入了哪些业务,企业采用了怎样的实践路径,以及项目上线后的投入和效果如何评估。

同时,我们也通过以下四方面的深入观察,洞悉项目建设和运行过程中出现的数据、知识、业务规则、流程与组织协作变化,以及这些积累对后续Agent建设的影响。

一、ROI难以量化已成为企业Agent规模化的首要问题

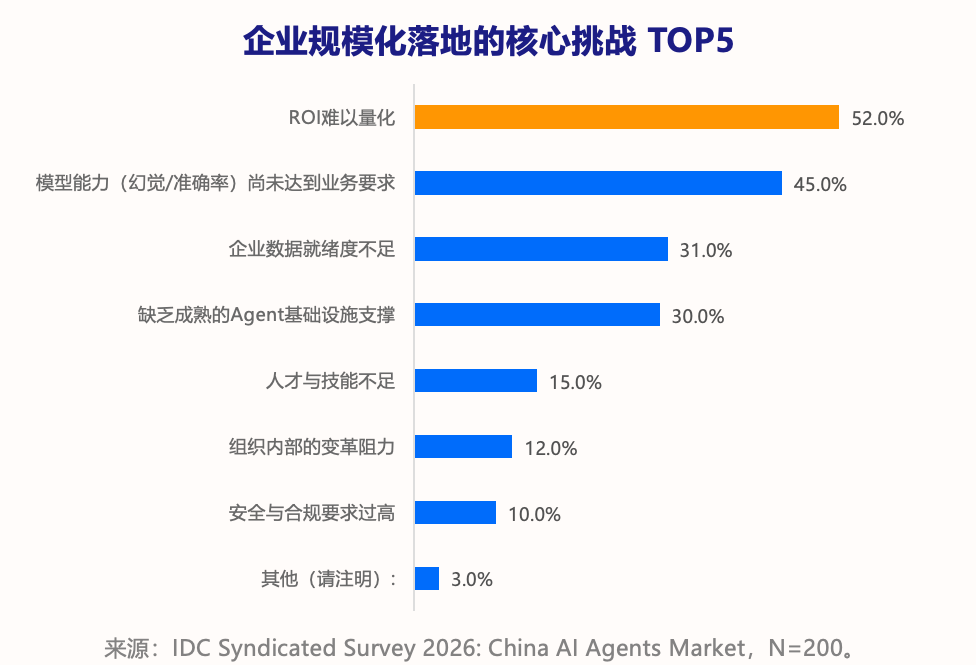
IDC中国企业智能体调研显示,52.0%的受访企业将ROI难以量化列为智能体规模化落地的最大挑战,远高于其它影响因素:模型能力尚未达到业务要求、Agent基础设施不成熟、人才与技能不足占以及组织内部的变革阻力。
在AI落地初期,部分企业基于推广普及AI的需求一般会更关注覆盖率、使用量和员工采用情况。另外当前部分企业主要落地的知识库问答或简单Workflow的智能体通常任务相对简单,模型调用、系统改造和持续运营投入有限,成本压力暂时不大。

但在复杂任务场景中,Agent则需要反复调用模型和工具,执行链路更长,多Agent模式下还会增加模型调用和系统交互频次,运行成本可能迅速上升。尤其是当前基于Harness架构、具备自主规划循环能力的Agent,在部分场景中的运行成本甚至可能超出企业可以承受的范围。

在涉及到业务和生产流程的高价值场景中,企业往往还需要数据治理、系统连接、权限与审计设计、业务规则整理和流程重构等基础能力建设。这些工作往往需要业务专家、IT团队和FDE长期参与,人力投入通常较高。

而在Agent带来的收益方面,往往又是分散在多个部门。企业如果缺少持续的业务数据监控机制,还需要跨部门统一指标口径、价值归属和成本分摊方式,收益核算会变得十分复杂,不亚于一次组织重构。以客服Agent为例,它可能减少坐席工时、提高一次解决率、缩短投诉周期、改善客户满意度,同时能够将新的问题和解决方法沉淀到企业知识库。经营分析Agent则可能缩短取数时间、统一指标口径、减少分析遗漏,并帮助业务人员更早发现库存、回款或客户流失风险。这些收益由客服、业务、数据、财务和风险管理等不同部门获得,价值兑现时间和衡量标准也有较大差异,难以核算清楚。

但即便当下Agent建设的ROI难以算清,企业也很难绕开这一关键指标。企业最终是要对利润和经营结果负责,Agent作为企业投入的项目同样需要说明这些成本投入能够为企业带来什

二、企业如何判断Agent项目是否值得持续投入

IDC在智能体的企业价值研究中也专门提到了要从战略匹配、用例优先级、价值映射、扩展成本、风险校正和持续优化等方面讨论Agent价值管理(《Agentic AI Business Value Maximization Framework: A Practical Guide for IT Leaders to Unlock Business Value from Agentic AI》)。

结合企业实践,可以用一条公式、两本账和三层观察来理解和应用这套方法,能够兼顾财务核算的严谨性和长期能力建设的观察需求。

  • 一条公式:把投入与回报算清楚

场景ROI=(年度可量化收益-年度TCO)÷年度TCO×100%

(注:公式中的年度TCO除了软件和模型费用,也应包含业务数据和知识的建设、相关系统的改造,业务、IT和实施团队长期参与迭代的投入。)

其中,年度可量化收益通常来自三类,第一类是降本,包括节省工时对应的综合人力成本、减少的外包支出和运营费用;第二类是增收,可以根据转化率增量、客单价、有效触达量或新增产能估算;第三类是风险规避,可以根据风险敞口、原始发生概率和Agent介入后风险发生概率的下降幅度,估算预期损失的减少额。这些收益都需要通过上线前后的业务基线计算增量,企业需要提前记录业务量、处理时间和人力投入,才能在智能体应用上线后形成可比较的数据。

  • 两本账:同时记录当期业务收益和长期能力资产

第一本是业务账,回答项目在当前周期产生了什么结果。处理时间缩短了多少,人工投入下降了多少,准确率、自动化率、客户转化率、风险发现率和业务采纳率发生了什么变化,这些指标关系到项目是否继续运行、相关Agent是否向更多部门推广,以及下一轮的投入预算。

第二本是能力账,观察企业的数据、知识、系统、人员和治理方式能否支撑Agent稳定参与实际业务,以及AI Ready与Agent Ready能力是否得到提升。这些变化会影响后续Agent建设的速度、应用范围和运行质量,也会改变企业未来的组织运行方式。

  • 三层观察:不同的层级需要关注不同的价值结果

企业不同层级关注的Agent价值结果有所不同,主要分为三层:

  • 场景层关注单项任务是否值得继续运行,比较投入与处理效率、质量、增长或风险控制结果。
  • 部门层关注Agent是否改善团队整体产能与业务表现,以及收益能否覆盖部门承担的持续成本。
  • 组织层关注跨部门复用、整体能效、治理体系和人员能力,评估Agent对企业运行方式产生的长期影响。

三、哪些Agent场景已经取得可验证的业务成效

本次案例研究覆盖的相关案例主要从两个维度展开研究:一是Agent在企业中落地了哪些业务场景,建设的方案和依赖的基础条件;二是项目运行后取得了哪些效果,以及企业是如何计算ROI的。(注:不同项目的场景和环境并不相同,相关统计数据不适用于跨案例对比。)

  1. 规则明确的重复流程最容易形成可量化结果

在案例研究中我们发现,很多业务工作流中传统需要大量人工处理重复操作的场景是最容易体现项目效果的。

例如在腾讯云与找钢网的案例中,其将Agent用于询价、报价和采购比价,原来需要近一小时完成的比价工作缩短到几分钟,报价效率也提升了10-20倍。来也科技帮助某电子元器件分销商处理订单,订单处理团队从约20人减少到1人,只需要负责监管和异常复核工作就能够完成大量的订单处理工作。在金智维与国盛证券的案例中,他们将证券运维中的CMDB查询接入工单和自动处置流程,把查询时间从数天或缩短到秒级。得帆与中国弹簧把计划物流、采购、排产和质量整改等业务流程整理为Skills,并连接企业业务系统帮助员工处理业务任务,实现整体效率70%—80%的提升。

  1. 数据检索和分析类场景任务能够显著提效

在数据分析方面智能体也在多家企业中展现出了业务价值,例如某全球医药企业原本需要排期2至5天完成报表查询和分析工作,采用神州数码的方案后缩短到分钟级。汉得帮助中亿丰建设了知识问答、经营分析和客商风险预警等问答和数据分析的能力,智能问数从小时级响应缩短至分钟级。迈富时为某全球美妆集团建设数据分析Agent,将经营决策周期从5天缩短到1天之内,支撑集团实现了更敏捷的经营管理能力。

  1. 营销和客服场景Agent已经带来了显著的业务回报

在销售和客户经营场景中,蓝凌与加福加德通过Agent将行业情报、客户资料、话术和配方知识实时提供给销售人员,可以在客户现场实时完成响应,并将日均有效触客量提升30%以上。蚂蚁数科与杭州银行案例中基于多个Agent处理客户洞察、产品分析和营销策略,项目测算显示,策略生成时间从天级缩短到分钟级。火山引擎与来伊份上线了预测补货、智能导购和AI客服等能力,其AI购物助手的下单转化率能够提升190%,AI客服已经可以独立回答约70%的咨询。

  1. 基于专业模型和算法的Agent在专业场景也有显著效果

百度伐谋使用Agent持续优化青岛港的配载算法,项目统计显示,算法迭代周期缩短50%以上,从数周缩短到小时级。商汤大装置的方案支持上海市规划和自然资源局通过自然语言调用地图和空间数据,处理城市治理任务,已经覆盖50多个核心场景,业务处理时长缩短60%,人均产出效率提升70%。

  1. 在组织运营场景Agent也能带来直接的产出提升

昆仑数智数字化咨询中心用Agent帮助完成AI组织变革,先以标准工单记录任务、责任与交付,再用任务督办、方案共创、消息监控、会议纪要和知识检索Agent智能化自动化的协助处理日常工作。部门平均任务响应时间从24小时缩短到4小时;人员规模缩减的同时,营业收入增长30%。

四、案例企业中Agent落地的最佳实践

综合案例研究,企业Agent的落地过程可以概括为一个业务价值闭环。Agent位于企业现有业务系统之上,负责协调判断与执行:先读取业务状态和任务输入,结合企业数据、知识与规则形成判断,再调用工具和系统完成业务动作,而执行结果、异常情况和人工反馈会被记录下来,继续用于更新知识、规则和评测依据,形成“感知—分析—执行—沉淀”的持续循环。
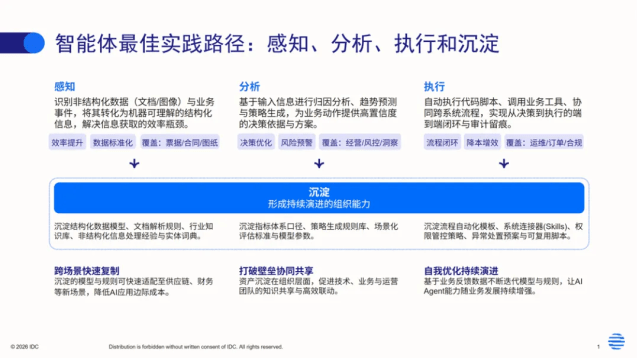
Source:中国企业级Agent最佳实践与案例精选(ROI视角)

  1. 优先选择结果可以验证的业务问题

期望短期把业务账算明白的企业,可以优先从业务量稳定、结果可以验证、责任人明确的业务场景开始,而能力账的建设投入则应该拉长ROI的观察周期,例如来伊份在企业实践中就分别为经营项目和战略项目设置了不同观察周期。

  1. 持续完善数据、知识和业务规则

专业Agent依赖企业对业务数据和知识的长期治理,智能体依赖的数据、知识和业务规则需要在实际使用中不断校正,才能确保其在业务场景中能够持续稳定运行。

  1. 业务人员需参与任务定义和结果验证

业务人员最清楚任务是否合理、结果能否使用,也最早发现Agent在真实工作中的偏差。例如得帆和中国弹簧的案例中,就由中国弹簧的业务人员参与提供了具体的Agent业务定义和测试样例,并完整参与了结果验证,这类做法能够确保Agent能够更符合业务需求。

  1. 把评估、治理和改进纳入日常运营

Agent上线后的评估和治理也是构成业务价值闭环的关键环节,企业需要根据真实运行数据发现偏差和风险,找出需要调整的环节,并持续更新迭代智能体以满足实际的业务需求。

更多内容请关注IDC报告:

如果您希望了解人工智能相关的研究或开展进一步交流,欢迎点击 联系我们!
Zhenya Sun

Zhenya Sun - Research Manager

Zhenya Sun is a research manager for the IDC team focused on exploring the application of technology and industrial development of AI and AI agents. He is also responsible for providing clients with consulting services on technologies, products, and markets…

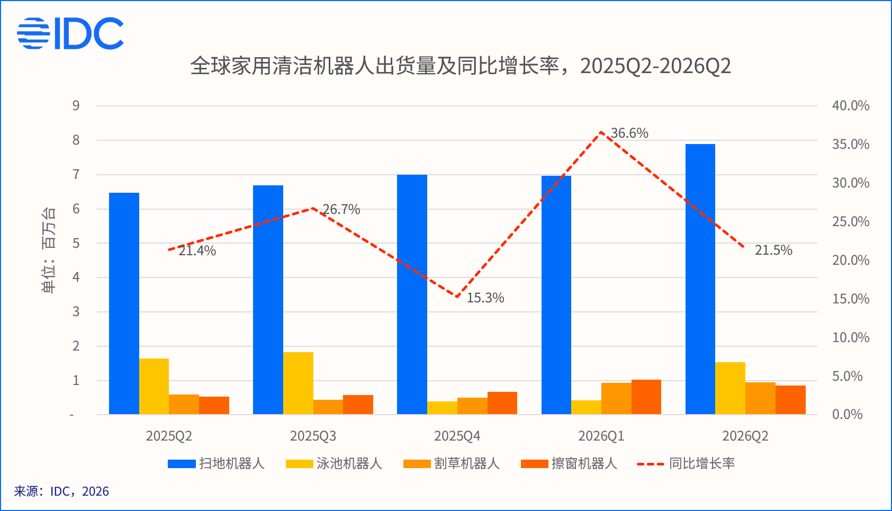
从扫地、割草到擦窗、泳池,家用清洁机器人正在从“单一爆品”走向“全场景清洁生态”。国际数据公司(IDC)最新追踪报告数据显示,2026 年第二季度,全球家用清洁机器人市场出货约 1120 .5万台,同比增长 21.5%。其中扫地机器人市场出货 788.5 万台,头部厂商集中度持续攀升。经历一季度 36.6% 的高增长后,二季度市场增速回归常态,但结构性分化进一步加剧:扫地机头部三强垄断格局固化,割草机器人延续高增,泳池机器人进入传统旺季。

本文以 IDC 最新追踪报告为依据,深度剖析扫地、割草、擦窗、泳池机器人细分市场的关键节点,助力行业伙伴制定科学可行的发展战略。

扫地机器人

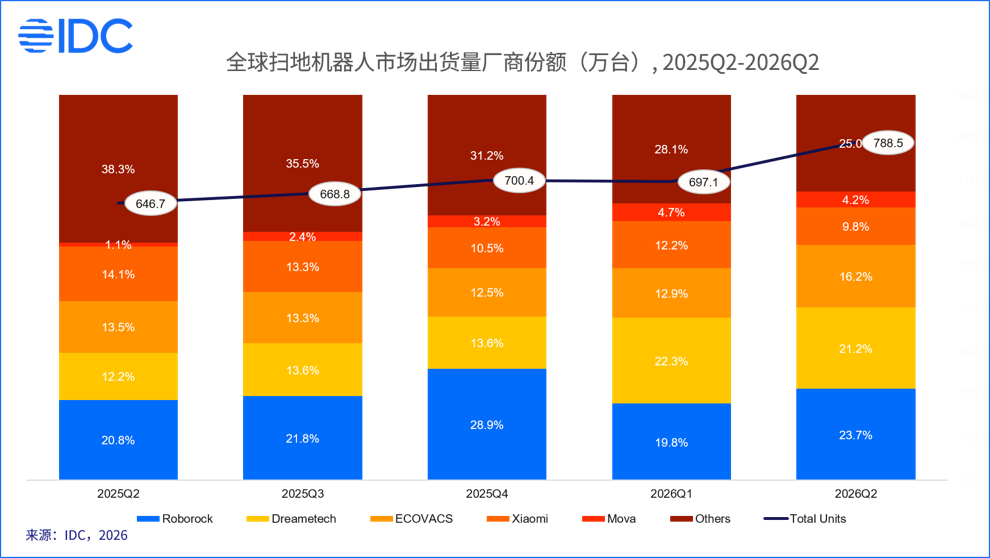
2026 年第二季度,全球扫地机器人市场出货 788.5 万台,销额达38.9 亿美元。市场集中度显著提升:前五大厂商合计占据 75% 的出货量份额和 82.0% 的销额份额。二季度欧洲市场持续引领增长,出货量同比增长64%,其中800美金(不含税)以上的高端机型出货占到欧洲市场的16.6%,在春促期间头部品牌大批量本地仓备货,低价品牌成本承压加速出局。欧洲市场终端机型降价促销,旗舰机型加速放量。

IDC 洞察:全球扫地机器人市场已经进入 “头部固化、尾部出清” 的阶段。头部商凭借技术研发、品牌溢价和全球化运营能力,持续拉大与中尾部品牌的差距,高端市场的利润和话语权进一步向头部集中。对于中尾部品牌而言,单纯依靠价格竞争已难以突围,必须在细分场景、差异化技术或特定区域市场找到生存空间。二季度全球扫地机器人平均售价约 4943美金(不含税),同比上涨7.9%,高端化趋势仍在延续,行业产品迭代逻辑告别同质化参数比拼,转向聚焦家庭真实深度清洁体验,平板、圆盘、滚筒等多类硬件方案同步演进、多元并行。

割草机器人

2026 年第二季度,割草机器人延续高景气态势,出货93.9万台,同比增长59.7%,保持高速增长。无边界机型已成为市场绝对主流,出货占比持续提升至84.2%。

IDC 洞察: 割草机器人的增长逻辑仍由供给端主导。头部国产品牌凭借从激光雷达、驱动电机、动力电池到整机代工的全链条国产化配套,在成本管控与交付周期上建立显著优势;与此同时,传统清洁龙头加速入局,推动行业格局快速出清,中小尾部品牌生存空间持续收窄。需求端,二季度欧洲及北美草坪进入生长旺季,季节性爆发特征显著;国产头部厂商今年以来持续加码北美线下渠道布局,市场起量迅速。价格端,全球割草机器人平均单价环比下探至 1,431 美元,国产供应链成本优化成效持续释放。

擦窗机器人

二季度全球擦窗机器人出货约 84.7 万台,同比增长59.8%,延续一季度的高增长态势。尽管二季度缺少一季度 “春节除尘” 的季节性拉动,但海外市场开拓和产品性能升级持续驱动需求增长。伴随行业规范落地、国标正式推行,市场资源与份额加速向头部品牌聚拢,全年赛道有望延续高增长态势。

IDC洞察:无线化、智能喷水、边角清洁等技术升级显著改善产品体验;欧美等市场的大面积玻璃、高层住宅及人工清洁成本进一步强化需求,同时中国品牌凭借成熟供应链和快速产品迭代加速全球渠道铺设,使擦窗机器人从小众尝鲜品类逐步走向大众化。

泳池机器人

二季度为泳池机器人传统旺季,全球出货约 153.3 万台,同比下滑6.3%。在地下泳池清洁机器人中,无缆产品占比持续提升至61.6%。高基数下换机周期拉长叠加欧美渠道去库存,中国品牌加速进入带来的价格竞争,使2026年Q2海外泳池机器人市场短期承压。

IDC洞察:疫情期间需求集中释放形成的高基数,正推动部分成熟市场步入存量换机周期;叠加欧美渠道去库存与住宅市场偏弱,短期出货端承压显著。供给端,中国品牌加速入局欧美市场,以无线化产品和高性价比策略加剧价格与份额争夺,传统品牌持续承压。二季度的小幅下滑本质上是成熟市场周期性调整与品牌格局重构的叠加结果,而非泳池机器人长期需求的根本性衰退。

IDC总结与展望

头部品牌不再只争夺扫地机器人这一单一市场,而是开始同时布局扫地、割草、擦窗、泳池等多个品类,争夺家庭清洁市场的整体份额。在这一过程中,行业竞争逻辑正在发生三个层面的转变:从卖硬件转向卖体验,从产品出海转向本地化经营,从打造单品爆款转向多品类协同。简而言之,家用清洁机器人正在从“单品爆款”走向“全场景生态”,竞争规则也随之改写。

第一,从卖硬件转向卖体验。
随着AI导航和具身智能技术不断成熟,机器人会越来越“聪明”,能够自己学习家庭环境、规划清洁路线,并根据用户需求做出调整。因此,未来产品之间的差距不只是硬件配置,更取决于软件算法、AI能力以及长期积累的数据。

第二,从产品出海转向本地化经营。

中国品牌出海正在从“把产品卖出去”,逐步转向“在当地扎下来”。除了发挥中国供应链的成本优势,头部品牌正在海外加快建设前置仓、线下门店和售后服务网络,并加强本地团队和渠道建设。未来,海外市场的竞争不只是产品竞争,更是物流、服务、渠道和品牌的综合竞争,率先完成本地化布局的企业,有望建立更强的长期竞争壁垒。

第三,从打造单品爆款转向多品类协同。
同时布局多个清洁品类,可以共享研发、供应链和销售渠道,降低整体成本;另一方面,也可以为消费者提供从室内到室外的“一站式家庭清洁方案”,提高客单价和用户复购。未来清洁机器人不再是孤立的家电,而会逐渐与门锁、摄像头、空调、音箱等智能家居设备连接,并与其他清洁机器人形成协同,为家庭提供更完整的智能服务

进一步交流

如需了解更多IDC相关研究或进一步与我们沟通,欢迎与 IDC 联系,我们将安排专人与您对接,为您提供定制化的市场洞察与咨询服务。请点击此处与我们联系。

Claire Zhao

Claire Zhao - Research Manager

Claire Zhao is a Research Manager for Client System Research of IDC China. She is responsible for conducting research on the augmented reality (AR)/virtual reality (VR) market, and vertical analysis for the PC market. She started working for IDC China as…

2026年,Agentic AI 已全面进入生产环境。然而,早期部署者正面临一个普遍且棘手的现象:活跃智能体数量平稳增长,而月度Token消耗与基础设施成本却出现数倍乃至数十倍的剧烈波动。单纯关注Agent数量已无法解释成本曲线的陡峭程度。本文基于IDC《Worldwide Agentic AI Adoption Guide》数据,从算力消耗结构、部署形态演进与行业渗透路径三个维度,给出2026-2030年的关键判断。

本文的核心结论:未来五年,企业智能体的竞争将从“数量战”转向“质量与路径之争”。真正的竞争优势将来自三大转向:从关注部署数量转向关注 Token 资源的实际承载效率;从套用全球模式转向拥抱“自定义配置+独立智能体”的中国特色路径;从一刀切部署转向结合行业基因的差异化布局。

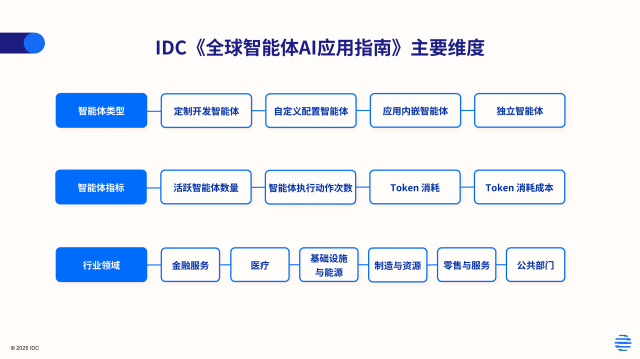
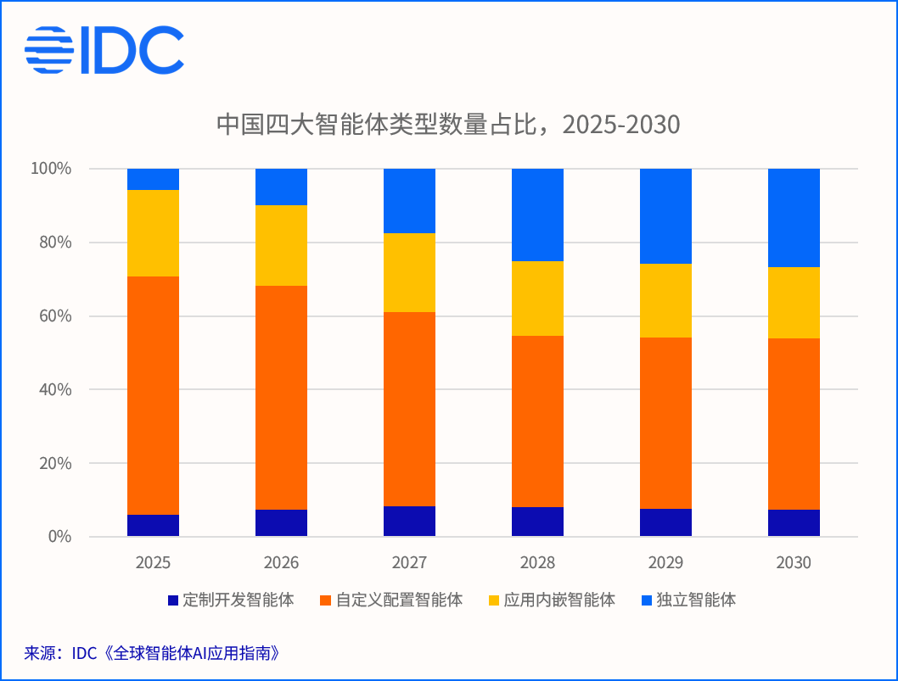
IDC《全球智能体 AI 应用指南》呈现了全球智能体AI的最新应用机遇与发展趋势,覆盖六大行业领域、四大智能体部署类型,围绕四项核心指标提供多维度的预测数据。

一、Token消耗增速远超Agent数量:算力预算的考量维度迎来重构

从总体规模来看,中国在活跃智能体数量、动作执行次数、Token 消耗以及相关成本等核心指标上,整体占全球近10%的市场份额。中国企业在 Agentic AI 的应用节奏上与全球大盘保持同步,本土落地准备度正加速释放。但更值得技术决策者关注的,是增长背后的结构性分化:

1. 智能体急剧“变忙”,单体任务Token消耗呈爆发式增长

最新趋势表明,Token消耗与动作执行数的增速已远超Agent数量本身的增速。这意味着,规模化的内涵正从“数量堆砌”转向“单个Agent的任务链长度与执行频次”。随着长上下文、多步推理及复杂工具调用成为常态,单次任务所需的Token消耗量正呈爆发式增长。

2. 算力降本反向刺激了更庞大的复杂需求

另一个关键信号是:Token消耗的年均复合增速(CAGR >3500%)远超企业实际成本增速(CAGR ~260%),体现出大模型单位推理成本的快速下降。正是这种“算力降本”带来了正向的弹性需求——企业不再满足于单次问答,而是敢于让Agent执行长链条自动化任务,从而形成了“Token消耗指数级增长、成本相对平缓”的剪刀差效应。

二、自定义配置统治力不改,独立智能体开启结构性跃迁

规模增长只是表象,部署形态的结构性变化才是更值得关注的底层逻辑。

IDC将智能体分为四类:定制开发(Bespoke)、自定义配置(Custom-configured)、应用内嵌(In-application)以及独立智能体(Standalone)。对比中国与全球的数据,一个极为显著的“中外双轨”现象浮出水面。

1. 自定义配置智能体:中国的统治形态,全球正加速追赶

在中国市场,自定义配置智能体占据了绝对主导地位。这一特征反映了中国企业IT生态的本土基因:一方面,中国企业的业务流程个性化程度高,标准化SaaS内置的Agent难以完美贴合实际工作流;另一方面,基于低代码/零代码平台进行自定义配置,既保留了编排专属工作流的灵活性,又大幅降低了开发门槛,成为中国企业综合ROI最优的选择。

放眼全球,2026年应用内嵌智能体仍是主流形态,但到2030年,全球自定义配置智能体在数量、动作与Token消耗占比将全面反超。全球正沿着中国已走通的道路演进——从“开箱即用”的标准化交付,转向“深度配置”的灵活平台。

2. 独立智能体:从“配角”到“核心骨干”的跃迁

另一个极为亮眼的趋势是独立智能体的崛起。独立智能体不依附于单一应用运行,可通过标准协议穿梭于 API、数据库、ERP、CRM 及各类微服务之间,承担跨系统的复杂任务。

未来五年,独立智能体在中国的Token消耗与动作执行数占比均将升至超三成——这意味着,独立智能体将从今天的“小众探索”跃升为企业自动化的核心支柱。对技术供应商而言,这不仅是产品形态的补充,更是卡位机会:谁能率先提供稳定、安全、可观测的独立智能体框架,谁就有望在下一轮企业级采购中占据先机。

三、零售与服务业占据主力,行业基因决定Agent部署逻辑

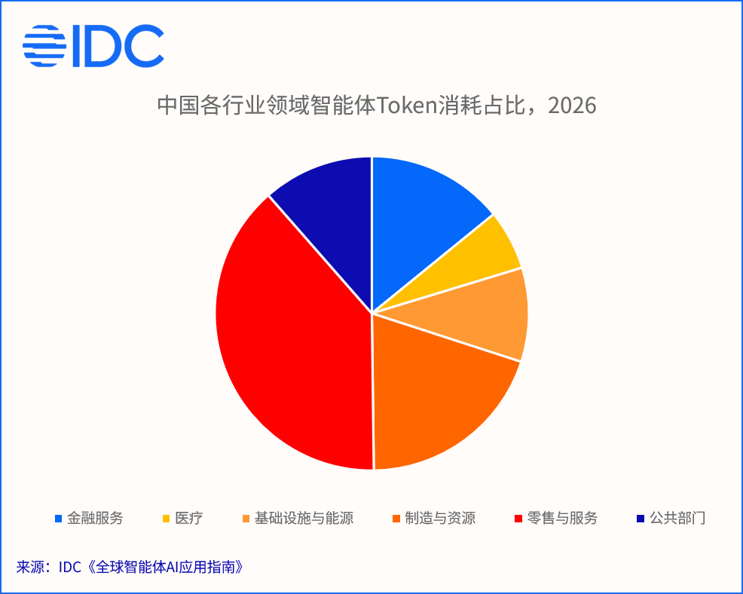
在行业分布上,中国市场呈现出“大盘结构极其稳定”的特征:零售与服务业占据了近四成的绝对主力;制造与资源业约占两成,金融服务业约占一成半。三者构成了中国 Agentic AI 应用的稳健基本盘。

但在大盘稳定的表象下,底层场景与部署形态却呈现出鲜明的行业分化:

  1. 零售与服务业内部形成双轮驱动格局

“零售与服务业”独占中国近四成的 Agent 算力与成本消耗,主要驱动力来自两个方向:

  • 业务侧:消费零售的高频客户交互。在面向消费者的前端场景中,Agent 被大量用于智能客服、个性化推荐、社群运营等。这一类场景的特点是“高并发、高频次”,构成了智能体动作次数的庞大基数。
  • 技术侧:软件与信息服务的AI原生开发运维。在软件与信息服务领域,Agent 正在深度重构软件工程全生命周期。从代码生成、代码审查到 DevOps 排障,代码与系统架构处理天然具备“上下文超长、多步推理、工具调用频繁”的特征,单次任务Token消耗往往是普通对话的数十倍。
  • 行业基因决定Agent的“部署偏好”

将行业数据与部署形态交叉分析,还会发现不同行业的Agent部署偏好存在鲜明差异:

  • 零售与服务:极度依赖自定义配置智能体和独立智能体。企业需要快速迭代营销策略与开发工具,要求Agent具备极高的编排自由度与跨系统能力。
  • 公共领域、基础设施与能源:自定义配置仍是第一大形态,但应用内嵌智能体的应用显著高于零售等敏捷型行业。此类稳健合规型行业对数据安全与系统合规有着极高要求,更倾向于将智能体活动限制在既有ERP、办公套件或国产化核心业务软件内部,优先保障数据不出域。

总结与展望:给企业决策者的行动指引

回顾2025-2030年中国Agentic AI的落地轨迹,结论已清晰浮现:这不是智能体数量的军备竞赛,而是企业运营模式的底层重构。未来五年的赢家,不是部署Agent最多的企业,而是最早理解并驾驭“Token消耗、部署形态、行业基因”三者互动关系的决策者。

基于上述洞察,建议企业重点推进三项战略行动:

1. 从“按并发数”转向“按Token容量”规划

企业面临的不是Agent数量增多的线性挑战,而是单个Agent复杂化导致Token消耗量爆发式增长。基础设施规划不能仅按当前对话调用量预估预算,需建立针对长上下文、多轮工具调用的算力容量模型,引入智能路由与缓存机制,避免成本失控。

2. 采取“自定义配置 + 独立智能体”的主流组合架构

海外应用内嵌的模式并非中国企业自主搭建核心智能体体系的优先选项,全自研同样不是最经济的选择。建议重点构建统一的低代码Agent编排平台:针对多数业务流程,采用自定义配置模式敏捷搭建;针对通用型跨系统复杂流程,重点布局独立智能体,形成企业的“数字化劳动力网络”。

3. 按行业基因制定部署策略

零售与服务等敏捷行业追求效率最大化,应给予自定义配置智能体与独立智能体充分的编排自由度;公共领域、基础设施和能源等强合规行业,非核心通用场景可以自定义配置为主,兼顾效率与管控;核心敏感流程优先采用自有系统内的私有化部署方案,将 Agent 活动范围限定在已通过安全认证的自有软件边界内。

Agentic AI 并非短暂的技术热潮,而是长达数年的生产力范式转移。深刻理解落地规律的企业,将在 2026 – 2030 年的智能化浪潮中,精准锚定架构方向,真正将 AI 转化为可持续的竞争优势。

备注:本文中的 Token 消耗仅统计生产环境中企业级智能体执行业务动作时产生的 Token 及 API 调用消耗,不包含模型预训练、消费级个人设备上的智能体以及独立生成式 AI(如通用聊天机器人)所消耗的 Token。

IDC对四类智能体的定义如下:

定制开发智能体(Bespoke agents):这类智能体依托专用的智能体 AI(Agentic AI)框架或平台实现,在 AI 智能体的设计、开发与部署全环节具备极高的灵活性与可定制性。纯代码级(Pro-code)智能体 AI 框架与平台最适配技术功底深厚的团队——这类团队需要对开发过程拥有极致掌控权,以此落地高度专业化的功能。

自定义配置智能体(Custom-configured agents):企业可围绕主流业务运营自动化需求,自行设计、配置并部署这类 AI 智能体,无需具备深厚的编程能力。低代码工具能够简化、加速 AI 智能体的开发流程,但和所有低代码 / 无代码工具一样,存在相应的权衡取舍:由于深度复用预构建的框架与组件库,开发过程中会内置预设的前提假设与能力边界。

应用内嵌智能体(In-application agents):应用内嵌智能体直接植入服务商的应用产品内部,用户无需跳出当前应用界面,即可借助它完成任务、获取问题解答,或是实现工作流自动化。

独立智能体(Standalone agents):独立智能体是面向特定场景打造的成品化智能体,由智能体服务商独立部署运行,不依附于某一款单一应用(典型如深度研究智能体、会议纪要智能体、客户支持智能体)。

IDC《支出指南》致力于为IT厂商、行业用户和投资/金融机构在战略规划、产品研发、IT支出及投资规划等方面提供数据支撑。《支出指南》系列产品聚焦IT热门领域,从多个维度预测市场规模和增速,助力厂商发掘市场潜力;引导行业用户根据热点技术及应用场景进行IT规划;通过分析特定市场的发展前景,帮助投资和金融机构更好地做出决策。

IDC《支出指南》相关研究:

China Provincial Cloud Solutions Spending Guide

Worldwide AI and Generative AI Spending Guide

Worldwide ICT Spending Guide Enterprise and SMB by Industry

Worldwide Software and Public Cloud Services Spending Guide

进一步交流:

如您希望进一步了解IDC《全球智能体AI应用指南》细分数据,或需要针对贵公司目标市场进行定制化数据解读,欢迎联系IDC中国分析师团队。请点击此处与我们联系。

Wendy Zhang

Wendy Zhang - Research Analyst

Wendy Zhang is a research analyst in the Data and Analytics group at IDC China. She is responsible for business operations and spending guide in China Enterprise Team. She provides dynamic forecasts of future China and global ICT market development.…

NVIDIA’s agreement to acquire Hugging Face stands to accelerate the transformation of open models into specialized enterprise intelligence.

Developers also use Hugging Face to access datasets, evaluate models, customize model behavior, and prepare digital solutions for production. The acquisition would extend NVIDIA’s business into the platform and services developers use to transform open models.

The finalization of NVIDIA’s acquisition of Hugging Face is all the more notable given the meteoric rise of open models in recent months. Increased adoption of open models in the enterprise has created demand for technologies that help organizations adapt these models to their business processes and sustain them in production. Hugging Face provides the development resources and community knowledge for this work, while NVIDIA provides capital, compute, and engineering expertise. Their combination stands to expand enterprise adoption of open models and intensify competition between open-model ecosystems and proprietary model providers.

NVIDIA has the potential to grow open-model development

NVIDIA’s agreement to acquire Hugging Face could create a stronger community of practice for open model development. Developers and technical decision-makers require post-training data, evaluation methods, reference architectures, recipes, cookbooks, and implementation guidance to transform open models into production digital solutions. Hugging Face provides many of these resources and supports the community relationships through which developers share and improve them. NVIDIA can contribute capital, engineering expertise, and experience with large-scale AI development. The combined organization can make effective development practices more accessible to enterprises, software vendors, researchers, and developers.

A stronger community of practice will help enterprises adapt open models to their business processes and workflows. Development teams can use shared recipes and cookbooks as starting points for post-training and then compare results based on quality, safety, latency, and cost. Developers can document the approaches that prove effective through reference implementations and adapt them to other projects. Testing across models and workloads will refine these methods over time.

China’s open models boost Hugging Face’s global role

China’s open-model ecosystem represents an important part of that platform. Qwen, DeepSeek, Kimi, and GLM have attracted communities that distribute models, create derivatives, publish datasets and evaluations, and develop methods for adapting these models to specialized requirements. Their participation broadens the technical depth and global relevance of Hugging Face.

Stewardship of Hugging Face gives NVIDIA responsibility for a global open-model community whose development extends well beyond its own Nemotron portfolio. The platform brings together models and developers from the United States, China, Europe, and other regions within a common development environment. NVIDIA’s position will depend on its ability to preserve that participation and support competing model families fairly. Successful stewardship would consolidate NVIDIA’s leadership across one of the most prized parts of the AI development ecosystem.

Open-model growth supports NVIDIA’s infrastructure business

Open-model development and enterprise adoption support NVIDIA’s infrastructure business through two distinct sources of GPU demand. Technology suppliers consume GPU capacity when they train, post-train, evaluate, and refine new model families and derivatives. NVIDIA benefits from these workloads even when other technology suppliers develop models that compete with its own portfolio. Hugging Face gives NVIDIA a direct role in the community through which many of these models and development resources are distributed.

Enterprise adoption creates a second source of demand for NVIDIA infrastructure. The more open models enterprises use, the more GPU capacity they consume to customize, evaluate, deploy, and operate them. This demand extends across accelerators, networking, software, cloud capacity, and enterprise support. Hugging Face can connect model selection and customization with the infrastructure required for production. It can also increase utilization across the AI factories that NVIDIA and its partners are constructing to support training and inference workloads.

This relationship gives NVIDIA a way to benefit from model proliferation across the industry. Large model providers continue to invest in custom silicon, and hyperscalers are expanding their own accelerators. Hugging Face provides NVIDIA with a broader source of infrastructure demand that extends beyond any single model provider or cloud platform. Every additional model family, derivative, and enterprise deployment can create workloads for NVIDIA technology. NVIDIA’s objective should be to offer the strongest technical and economic implementation path for the models developers select.

NVIDIA gives Hugging Face greater capacity to fulfill its mission

NVIDIA gives Hugging Face access to the capital and computing infrastructure required to expand its mission. Hugging Face must support a rapidly expanding collection of models, datasets, digital solutions, and development resources. Model hosting, post-training, synthetic data generation, evaluation, and inference also require substantial computing capacity. NVIDIA can fund the infrastructure and longer-term investments needed to expand Hugging Face’s repository offerings, improve platform reliability, and strengthen its tools for model customization and evaluation.

These investments can make open-model development accessible to more developers, researchers, and enterprises. Greater capacity can also help Hugging Face support organizations that require reliable services throughout the production lifecycle. Enterprises need technical support, predictable service levels, model updates, security controls, and governance processes. NVIDIA has the engineering resources and enterprise experience to help Hugging Face address those requirements.

Hugging Face’s neutrality is essential to the acquisition’s value

Hugging Face’s neutrality is essential because developers rely on the platform to access technologies from competing providers. NVIDIA has committed to preserving choice across models, frameworks, cloud services, inference providers, and computing platforms. Developers will not need to use NVIDIA hardware to build on or deploy through Hugging Face. Continued support for AMD accelerators, hyperscaler chips, and other infrastructure will be necessary to maintain confidence in that commitment.

Fair treatment must extend to models that compete with NVIDIA’s portfolio, including those developed on NVIDIA GPUs. The platform must also remain neutral toward models developed on non-NVIDIA accelerators. Hugging Face should apply consistent policies to model discovery, evaluations, featured content, hosting, and distribution. Governance of these functions should remain separate from the commercial priorities of NVIDIA’s model-development teams. Hugging Face will create greater value for NVIDIA if developers continue to trust it as a platform for the entire open-model ecosystem.

Open-model momentum is reshaping the AI infrastructure landscape

NVIDIA’s agreement to acquire Hugging Face places it alongside OpenAI, Anthropic, SpaceX, Google, and Meta among the small group of companies positioned to shape how AI is developed and delivered. Each company combines models, developer technologies, distribution, and access to large-scale compute in a different configuration. NVIDIA’s position brings together Nemotron, Hugging Face, and the industry’s leading AI infrastructure portfolio.

Competition among these companies will produce multiple forms of intelligence across proprietary frontier models, open-model families, and specialized enterprise models. Organizations will select and transform these forms of intelligence according to their business processes, workflows, data, and operating requirements. The acquisition positions NVIDIA to influence both the development of this increasingly diverse market and the infrastructure that supports it. Whether AMD accelerators and hyperscaler chips remain fully supported on the platform NVIDIA now owns will be one test of that influence.

Arnal Dayaratna

Arnal Dayaratna - Research Vice President, Software Development

Dr. Arnal Dayaratna is Research Vice President, Software Development at IDC. His research focuses on agentic AI, generative AI, foundation models, agentic coding technologies, and low-code and no-code developer technologies. He also examines the broader technology stack around foundation models,…
Ashish Nadkarni

Ashish Nadkarni - Group Vice President and General Manager, Global Domain Lead, Enterprise Infrastructure

Ashish Nadkarni leads IDC's enterprise infrastructure global research domain, which comprises five global research subdomains (coverage areas): computing (semiconductors and enabling technologies, classical and quantum computing); cloud, edge, and datacenter infrastructure/services; data management and storage infrastructure; networking infrastructure, and lifecycle,…

In the second quarter of 2026 (2Q26), the worldwide Ethernet switch market reached $18.9B, growing 43.4% year over year (YoY), according to IDC’s Quarterly Ethernet Switch Tracker. The datacenter segment (covering high-speed switching infrastructure in hyperscale, service provider, and enterprise datacenters) grew 64.5% YoY to $12.3B, driven by continued build-out of AI training and inferencing infrastructure.

800GbE ports accounted for 41.2% of datacenter revenues, reflecting the relentless push toward higher speeds to meet AI cluster bandwidth demands. The non-datacenter (campus and branch) segment grew 15.7% YoY to $6.6B, supported by enterprise hardware refresh activity and higher component pricing.

The worldwide Router market reached $4.5B in 2Q26, growing 22.8% year over year, according to IDC’s Quarterly Router Tracker. Both the service provider and enterprise segments posted double-digit growth, with the Americas leading the growth across all regions.

Ethernet switch market highlights

Datacenter segment: The datacenter portion of the Ethernet switch market grew 64.5% YoY in 2Q26 to reach $12.3B, according to IDC. The AI infrastructure build-out continues to be the primary growth driver, as hyperscalers, cloud providers, and large enterprises expand capacity for generative and agentic AI training and inferencing workloads. High-speed ports dominate spending: 800GbE switches accounted for 41.2% of datacenter segment revenues, while 200G/400G speeds represented 33.6% — together making up nearly 75% of datacenter Ethernet switch spending.

Campus/branch (non-datacenter) segment: Enterprise campus and branch Ethernet switch revenue grew 15.7% YoY in 2Q26 to $6.6B, per IDC. A broad hardware refresh cycle remains the structural driver, as organizations upgrade aging switching infrastructure to support the latest wireless standard, Wi-Fi 7, and AI-capable workloads. AI-powered network management and integrated security, including post-quantum cryptographic capabilities, are other key drivers in this segment. Higher average selling prices, driven by component cost pressures, continue to contribute to revenue growth above underlying unit volumes.

Regional performance: Ethernet Switch revenues grew across all geographies in 2Q26, according to IDC. The Americas led with 50.4% YoY growth to $10.2B, reflecting robust hyperscaler and enterprise AI investment in North America. EMEA grew 36.9% YoY to $4.1B, while Asia Pacific posted 35.3% growth to $4.6B.

Router market highlights: The total Router market reached $4.5B in 2Q26, growing 22.8% year over year, driven by investment in both service provider and enterprise network infrastructure, according to IDC’s Quarterly Router Tracker.

Service provider segment: The service provider segment — including communications service providers and cloud SPs — made up 74.2% of total router market revenues in 2Q26, reaching $3.3B with 23.8% YoY growth. Cloud and telecom infrastructure upgrades, including 5G backhaul expansion and core network modernization, remain the primary growth drivers.

Enterprise segment: The enterprise router market contributed $1.2B in 2Q26, growing 20.1% YoY, reflecting sustained investment in enterprise WAN connectivity, SD-WAN-enabled infrastructure modernization, and the expansion of AI-ready branch and edge network environments.

Regional performance: The Americas router market rose 31.1% YoY in 2Q26 to $1.9B, leading all regions. EMEA grew 20.9% YoY to $1.1B, while Asia Pacific posted 15.2% growth to $1.5B.

Vendor highlights

Cisco: Cisco’s total Ethernet switch revenues grew 36.2% YoY in 2Q26 to $5.4B, maintaining a 28.7% market share and retaining the #1 market share position in the overall Ethernet switch market, per IDC. In the datacenter segment, Cisco generated $2.2B (18.2% share), growing strongly with AI networking demand. Cisco’s total router revenue grew 31.6% YoY to $1.6B, with a 34.7% share of the global router market.

NVIDIA: NVIDIA’s Ethernet switch revenues — entirely from the datacenter segment — surged 181.1% YoY to $2.5B in 2Q26, giving it a 20.4% share of the datacenter Ethernet switch segment, according to IDC. NVIDIA maintained its position as the #1 branded vendor by revenue in datacenter Ethernet switching. The Spectrum-X platform — an end-to-end AI networking solution integrating Spectrum Ethernet switches with BlueField DPUs and NVIDIA LinkX cables, purpose-built for large-scale GPU clusters — continues to win hyperscaler and AI-native cloud provider deployments at scale.

Arista Networks: Arista’s revenues grew 37.6% YoY in 2Q26 to $2.5B, per IDC, with the company holding a 13.4% share of the total Ethernet switch market and 18.7% in the datacenter segment. With approximately 90.9% of revenue from the datacenter segment, Arista continues to maintain a strong position in 400G and 800G deployments among hyperscale and cloud customers.

Huawei: Huawei’s total Ethernet switch revenue grew 28.6% YoY in 2Q26 to $1.5B, with an 8.2% market share, per IDC. Huawei’s Router revenue grew 21.6% YoY in 2Q26 to $1.3B, giving the company a 29.9% share of the global router market — underscoring continued strength in service provider networking, particularly in China and select emerging markets.

HPE: HPE’s total Ethernet switch revenue grew 1.6% YoY in 2Q26, reaching a 6.1% market share, per IDC. HPE revenues include Juniper Networks, following the July 2025 acquisition. The company’s campus and branch portfolio, which represents approximately 70.1% of its Ethernet switch business, continues to benefit from the enterprise hardware refresh cycle. HPE’s router revenues grew 25.3% YoY to $483M in 2Q26, representing a 10.7% market share.

Worldwide Top Ethernet Switch Companies

Market dynamics

AI infrastructure fuels another quarter of record datacenter spending: For the second consecutive quarter, AI infrastructure investment drove Ethernet switch market growth above 40% YoY. Hyperscalers and AI-native cloud providers are accelerating the deployment of GPU-dense AI factories, requiring ultra-low-latency, high-bandwidth switching fabric capable of sustaining the massive east-west traffic flows generated by distributed training workloads. The share of 800G ports in datacenter Ethernet switch revenues rose to 41.2% in 2Q26, up from 35.9% in 1Q26, reflecting a clear and accelerating shift toward next-generation port speeds.

Enterprise refresh and pricing dynamics sustain non-datacenter growth: Non-datacenter Ethernet switch revenue grew 15.7% YoY in 2Q26, sustained by a multi-year enterprise hardware refresh wave and persistent component-price inflation. Organizations are upgrading campus and branch switching infrastructure to support newer wireless standards, AI-capable applications, and modern digital workloads. IDC notes that supply cost pressures — particularly in memory components — continue to inflate revenue growth above underlying unit shipment trends, a dynamic that is expected to persist.

Router market accelerates on SP and enterprise investment: The router market’s 22.8% YoY growth in 2Q26 reflects broad investment across both segments. Service providers are investing in network infrastructure to support 5G expansion, cloud interconnect, and edge deployments. Enterprise demand reflects ongoing WAN modernization, SD-WAN adoption, and the expansion of AI-ready branch and edge environments. The Americas accounted for 41.9% of global router revenues in 2Q26, growing 31.1% YoY — the fastest regional growth rate — driven by strong North American SP and enterprise network investment.

“

AI cluster buildouts are now the single biggest driver of datacenter network spend, and the rapid move to 800GbE shows hyperscalers optimizing for bandwidth and latency more than ever before. As GPU clusters keep scaling, switching fabric and related networking has become one of the fastest-moving and most critical layers of AI infrastructure investment.

— Paul Nicholson, VP, Research, Cloud and Datacenter Networks, IDC

“

The campus refresh cycle is accelerating as organizations modernize switching infrastructure to support Wi-Fi 7, AI workloads, and higher-speed connectivity. The convergence of networking and security—including post-quantum cryptography and rapid AI-driven threat patching—is reshaping infrastructure requirements and driving sustained upgrade momentum through 2026.

— Brandon Butler, Senior Research Manager, Enterprise Networks, IDC

Why it matters

The 2Q26 results confirm that AI infrastructure demand is the defining force in the datacenter networking market, with sustained implications for vendor strategy, technology architecture, and enterprise procurement. The accelerating shift toward 800G and beyond is compressing product cycles and raising the stakes for vendors to maintain technology leadership. Outside the datacenter, enterprise networking teams face a critical decision point: legacy campus and branch infrastructure must be modernized to support AI-capable applications, next-generation wireless, and the increasing data throughput demands of digital operations. For enterprise buyers and IT leaders, the 2Q26 data underscores the urgency of aligning networking refresh cycles with a multi-year AI buildout that is accelerating, not plateauing.

Outlook

IDC expects the Ethernet switch market to continue posting strong year-over-year growth through 2026, driven by ongoing AI infrastructure investment in the datacenter and sustained enterprise refresh demand in the campus and branch segments. The pace of 800G adoption is expected to accelerate further, and early demand signals for 1.6T ports are beginning to emerge as hyperscalers plan next-generation AI cluster architectures. In the router market, service provider investment in 5G core and backhaul infrastructure, combined with enterprise WAN modernization, is expected to sustain double-digit growth. IDC will continue to track these dynamics through its quarterly tracker programs.

Paul Nicholson

Paul Nicholson - Research Vice President, Networking and Infrastructure Services, Enterprise Infrastructure

Paul Nicholson is Research Vice President within IDC’s enterprise infrastructure global research domain and part of the networking infrastructure and services subdomain. He focuses on AI, cloud, and datacenter network infrastructure. His research spans Ethernet and InfiniBand switching, application delivery…
Brandon Butler

Brandon Butler - Senior Research Manager, Networking and Infrastructure Services, Enterprise Infrastructure

Brandon Butler is a Senior Research Manager within IDC’s enterprise infrastructure global research domain and part of the networking infrastructure and services subdomain. His research covers market and technology trends, forecasts, and competitive analysis in enterprise campus, branch, and edge…
Petr Jirovsky

Petr Jirovsky - Senior Research Director, Networking and Infrastructure Services, Enterprise Infrastructure

Petr Jirovsky is a Senior Research Director within IDC’s enterprise infrastructure global research domain and part of the Networking and Infrastructure Services subdomain. He provides quantitative insights on network infrastructure for the datacenter, cloud, and campus/branch environments. He serves as…
Diego Anesini

Diego Anesini - VP Data and Analytics, Networking

Diego Anesini serves as Vice-President, Data & Analytics, Networking. Prior to this position, Diego held various roles in the company. The most recent was VP, Data & Analytics for Latin America. He has extensive experience in the Networking, Telecom and…

It’s all in the name: Real Results. IDC’s annual FinTech Rankings and Real Results program doesn’t hand out recognition for a slide of names. It looks for technology providers that made a measurable difference at real financial institutions, and this year’s winners are now live, marking the 24th year of the Rankings and the 14th year of Real Results.

We sat down with Jerry Silva, Program Vice President at IDC Financial Insights, to talk through what these programs measure, what changed in this year’s submissions, and where the money is moving next.

What is the IDC FinTech Rankings program?

The Rankings started as a straightforward ask from IDC’s institutional clients: banks, capital markets firms, and insurance carriers who wanted a clear picture of the technology landscape serving their industry. “They really wanted from us kind of what the landscape looked like in terms of technology providers,” Silva says

IDC evaluates and categorizes technology providers by prior-year revenue from financial institutions across hardware, software, and services. Two lists come out of that work. The Top 100 covers firms that specialize in financial services: more than a third of their revenue comes from the industry, and they don’t spread across more than two other verticals. The Enterprise Top 50 covers larger, broader technology firms, think Microsoft, IBM, Dell, that generate meaningful financial-services revenue without being narrowly focused on the industry.

What separates the Top 10 from the rest of the list

Making either list depends on revenue. Where a company lands within it depends on something else. Silva points to product and capability range as the real differentiator between the Top 10 and everyone below it. Companies further down tend to specialize in one function, like payments or fraud, while the leaders cover core banking, payments, risk and compliance, customer experience, and data and analytics all at once. “Those companies at the top of the list tend to be incredibly broad,” he says.

How Real Results complement the rankings

Rankings measures size and reach. Real Results measures something else entirely: whether the technology actually worked. The program was Silva’s addition, and it came from a specific frustration. After decades on the institution side of the industry, he’d grown tired of innovation awards that never tied back to a measurable outcome. “I kept seeing all these innovation awards out there that never really focused on what was the benefit,” he says. “It was always about, well, this will enable the client to do X, Y, Z in the future. Well, that doesn’t help me.”

So Real Results asks technology providers to submit case studies: real projects, at a named institution, with a verified metric attached. IDC contacts someone at the institution directly to confirm the numbers. Fourteen years later, the program covers seven categories: infrastructure modernization, omni-experience customer engagement, treasury and trade, payments, capital markets, insurance transformation, and digital trust and stewardship.

The bar is strict. “If a submission doesn’t have those numbers, doesn’t have quantifiable, measurable benefits, I disqualify it,” Silva says. Projections about future value don’t qualify. IDC only considers results that have already happened..

The biggest shift in this year’s case studies: AI, everywhere

That bar produced a clear pattern in this year’s submissions. Historically, no single technology dominated Real Results entries. The closest IDC came to a unifying trend was the cloud migration wave of 2018-2019. That’s changed. For the past two years, AI has driven nearly every entry, and this year’s winners went further than a single AI tool.

“Most of the winners, all except maybe one, used a combination,” Silva says: traditional machine learning, generative AI for content creation, and agentic AI to orchestrate the whole process, often in the same project.

The overall winner illustrates it well. A large bank had a legacy process scattered across multiple systems, and instead of stitching those systems together point to point, the technology provider used machine learning and generative AI to create usable data out of the legacy sources, with AI agents orchestrating the process end to end. The result was fewer errors and lower costs, with a process that used to take days now finishing in hours.

Where financial services technology spending is headed next

That same AI-everywhere pattern shows up in where the market is headed next, though not in the part of the business most people assume. Over the past six to nine months, investment has shifted away from front-office, customer-experience projects and toward the back office: modernizing databases, finance platforms, and HR systems.

Two forces are driving it. Most institutions don’t have their data in a state that’s ready for AI to run against multiple sources at once, so they’re investing to fix that first. And once an AI platform is in place, institutions want a more open, API-driven back office instead of stitching new tools to legacy systems one connection at a time.

The scale of that investment is notable on its own. IDC’s newest forecast puts financial services technology spending, hardware, software, and services combined, at more than a trillion dollars a year globally by 2030, growing around 12% annually. “I think you’ll see a huge shift to the back office until they start solving some of those problems,” Silva says.

Where to see the full 2026 IDC FinTech Rankings winners

The full 2026 IDC FinTech Rankings and Real Results winners are live now. Twenty-four years in, institutional clients still use the list the same way they did at the start: as a shortlist. As Silva puts it, when institutions are evaluating a project, “the list actually helps them narrow down that short list.”

Christina Cardoza - Content Marketing Manager - IDC

Christina Cardoza is a Content Marketing Manager at IDC, where she specializes in brand content and social media strategy. With a background in journalism and editorial leadership, she has a proven ability to transform complex technology topics into clear, actionable insights.

Apple used this cycle to launch its first foldable iPhone, the iPhone Duo, alongside the iPhone 18 Pro family, Apple Watch Series 12 and Ultra 4, AirPods 5 and to widen the Apple Intelligence and Siri AI story across the range. The iPhone Duo is the flagship, a test of whether design, ecosystem and premium positioning can reshape a segment that has largely failed to appeal to the mainstream consumer.

Pricing was at the center of the event. At a time when we expected prices to rise beyond what consumers are comfortable paying due to memory costs, Apple held its increases below what we expected. The iPhone 18 Pro arrives at $1,199 and the Pro Max at $1,299, each only $100 up from last year (we expected at least a $150 increase). The company kept the starting price of its new Apple Watch Series 12 and Ultra the same as last year ($399 and $799). AirPods 5 bring active noise cancellation to a $129 entry point, $50 below the $179 price of the noise-cancelling AirPods 4. The foldable, Apple’s most expensive iPhone yet, starts at $1,999 versus an industry expectation of $2,499, which was the biggest surprise of all. Apple expanded the number of products it offers at mainstream prices and opened a super-premium tier at the top, all in a single keynote.

Apple Watch and AirPods strengthen the ecosystem

Apple Watch Series 12 and Ultra 4 put health sensing at the center. Both use the Apple S11 chip and a redesigned sensing system that reads heart rate every five seconds and heart-rate variability every five minutes, enough for continuous measurement rather than the isolated readings of previous versions. The new Readiness score combines training load, vitals and sleep quality, and the redesigned Health app adds Insights, Longevity and a Health Age metric, with Apple Intelligence underneath it. The proposition is moving from measurement toward interpretation and guidance, and looks to bring Apple into line with fitness-focused devices and services such as Whoop.

Audio Intelligence features on the watches, designed to help you hear what you missed (Live Rewind), capture sounds (Sound Recognition) or capture notes (Siri Recap), find Apple attempting to walk a fine line between always-listening ambient AI computing and its desire to respect users’ privacy.

AirPods 5 apply the same pricing logic lower down the range. The $129 model brings ANC to the entry point, and the $149 version adds volume swipe, wireless charging and an extra hour of battery. Apple says the new ANC is 50% better than its prior open-ear model with ANC. Lowering the entry price pulls more people into a companion device they rarely give up.

iPhone 18 Pro Series reinforces the premium core

The iPhone 18 Pro and Pro Max defend the conventional flagship through performance, imaging and AI. The A20 Pro runs on-device Apple Intelligence, with Private Cloud Compute handling heavier work, and the 48MP Fusion main camera adds a physical variable aperture as wide as f/1.48. The most notable addition is Apple Reference Image, which signs pixel-level data at the sensor so a user can prove a photo was captured on the device and not altered. These products hold the premium core in place while the Duo enters above it, the Pro at $1,199 for 256GB and the Duo at $1,999 for the same storage.

18 Base Model moves to spring, redefines cadence

While the spotlight is on the Duo today, an important factor is the silent omission of the 18 base models. Apple’s shift of the base iPhone 18 to spring is a portfolio decision, decoupling the base models from the premium lineup in the fall.  According to IDC, the last two base iPhone launches drove 16% of Apple’s total shipments in their first two quarters, though as lower-ASP devices their share of revenue runs below that unit figure. The new cadence allows Apple to even out its performance seasonality throughout the year and give each line clearer positioning. 

Apple has also diversified its iPhone lineup into six different models, widening its demographic reach.  The six are clearly grouped into two categories: the premium line (Pro, Pro Max, and Duo) launches in the fall; the budget-friendly line (base, E, and Air) follows in the spring. Each wave of devices gets a clear commercial narrative instead of six SKUs competing for the same spotlight.

iPhone Duo changes the foldables equation

The iPhone Duo is a polished piece of first-generation hardware.  It positions foldability as a finished product rather than a work in progress. It pairs a 7.6-inch internal Super Retina XDR display with a 5.4-inch external one and runs on the A20 Pro with a dedicated display engine and a custom titanium hinge of more than 100 components, high-strength glass and a nano-texture finish meant to cut glare and play down the crease.

 The software is the more differentiated part, with fluid transition from closed to open, intuitive execution of side-by-side apps, paired apps for repeated workflows, content movement between them, use in partly folded orientations and a redesigned standby, with Apple Pencil USB-C support due later this year. The point is to make the larger display more useful in day-to-day use rather than just feeling like a bigger phone. As with any first-generation foldable, the open questions are hinge and display durability over time and how the crease and added weight hold up in daily use.

Pricing starts at $1,999 for 256GB and passes $3,000 at 2TB of storage. That entry sits $500 below the $2,499 the market expected, and at roughly 1.6 times Apple’s non-foldable iPhone ASP of around $1,209. IDC still puts the blended iOS foldable ASP higher once storage mix is counted. Apple has not built a mass-market device. It has created a premium product for high-value iPhone users, which lets the Duo lift both foldable volume and Apple’s premium mix.

A value opportunity, not a volume-led category

IDC’s forecast explains why the Duo can matter even if foldables stay a small share of the market. Worldwide foldable value grows from $26.7 billion in 2025 to $42.0 billion in 2026 and $68.2 billion by 2030, a 20.6% CAGR from 2025 to 2030, while units rise from 20.3 million in 2025 to 35.8 million in 2030. Value grows faster than volume, which is what makes the segment worth Apple’s attention. Foldables move from 2.2% of global smartphone units in 2026 to 3.1% in 2030, but their revenue share climbs from 6.9% to 10.0%.

Apple does not need unit leadership for the Duo to pay off, though its design and price could deliver that as well. Supply may be the initial constraint, as Apple’s exacting standards make the unit hard to manufacture in large volumes at the start. We expect the company to ship roughly ten million units in the first 12 months. With Android foldable units forecast to fall this year, IDC expects Apple’s entry to be the main driver returning the segment to growth. The gap between value and unit share is the key: Apple can take a disproportionate share of category revenue by setting the premium reference point.

The China Test

China is the toughest test for the Duo, and also its clearest value opportunity. Huawei led the market with 79.4% of foldable units and 82.2% of value in the second quarter of 2026, backed by an established range, market familiarity and channel strength. IDC projects iOS foldables in China to reach 2.0 million units and $4.9 billion in value in 2026, rising to 4.4 million units and $10.3 billion by 2030, with Apple’s share of China foldable value growing to 50.8% and its unit share to 39.7% over the same period.

Apple leads on value well before it leads on units, which fits a premium entry priced above the rest of the market. The requirement is execution: industrial design, durability, display quality and app support strong enough to trade buyers up in a market that already has credible alternatives. If it gets that right, Apple can take a meaningful share of category value, helped by its standing as an aspirational brand. Get it wrong, and Huawei’s entrenched lead and China’s support for homegrown brands could hold the Duo to a niche.

What the September lineup signals

Taken together, the lineup reads as one strategy: AirPods lower the barrier to a premium feature, Apple Watch adds health value while holding price, the iPhone 18 Pro defends the premium core with measured discipline, and the iPhone Duo opens a new high-value tier below the price the market expected. Each move serves a larger active installed base, more multi-device ownership and stronger ecosystem attachment, with Apple Intelligence and Siri AI as the connective layer and on-device processing supporting the privacy story.

The real test for Apple is whether it can make foldables a more valuable category, own the defining premium product and use that position to extend the economics of the iPhone portfolio. IDC’s forecast suggests it can, with Apple positioned to be a principal driver of category growth through 2030.

Getting there requires strong first-generation execution, a convincing software story, and a credible strategy in China. Deliver those and the iPhone Duo stops being a new form factor and becomes a margin engine and a mix lever, and a sign Apple can still shape a category it entered years after competitors did. 

Francisco Jeronimo

Francisco Jeronimo - VP, Data and Analytics, Devices, IDC EMEA

Francisco Jeronimo is VP for Data and Analytics at IDC EMEA. Based in London, he leads the research that covers mobile devices, personal computing devices, emerging technologies and the circular economy trends across EMEA. His team delivers data on personal…
Tom Mainelli

Tom Mainelli - Group Vice President, Device & Consumer Research

Tom Mainelli heads the Device & Consumer Research Group, overseeing a wide array of hardware and technology categories catering to both home and enterprise markets. His team's research spans PCs, tablets, smartphones, wearables, smart home devices, thin clients, displays, and…
Nabila Popal

Nabila Popal - Senior Director, Data & Analytics

Nabila Popal is Senor Director with IDC's Data & Analytics team, specializing in Mobile Phones, PC Monitors and other consumer devices.  Ms. Popal is responsible for the global research and quality and timely delivery for her respective technologies, coordinating with regional…

The worldwide WLAN market reached $3.2B in the second quarter of 2026 (2Q26), growing 23.2% year over year (YoY). That’s an acceleration from the 15.6% growth in 1Q26. The quarter’s growth reinforced Wi-Fi 7 (802.11be) as the new dominant Wi-Fi standard in the enterprise.

The results span all major regions and vendor tiers. The market has moved past its early-adoption phase into a full replacement cycle.

WLAN market highlights

  • Total market: The worldwide WLAN market grew 23.2% YoY in 2Q26, reaching $3.2B. That’s a meaningful acceleration from the prior quarter. The enterprise dependent access point (AP) segment grew 27.6% YoY to $2.7B, outpacing the broader market and reflecting sustained corporate investment in dependent wireless infrastructure. The pace of growth suggests that enterprise Wi-Fi refresh cycles are broadening beyond early adopters to mainstream deployment.
  • Wi-Fi 7 momentum: Wi-Fi 7 dependent AP revenues reached $1.4B in 2Q26, representing 53.0% of enterprise dependent AP revenues and growing 219.5% year over year. This transition reflects the convergence of a maturing Wi-Fi 7 product ecosystem, enterprise demand for higher-throughput infrastructure, along with the pull-forward effect of AI-driven network requirements and AI-powered wireless management.
  • Wi-Fi 6/6E trajectory: As Wi-Fi 7 adoption continues, earlier-generation standards are declining in share. Wi-Fi 6 accounted for 29.4% of enterprise dependent AP revenues in 2Q26 (down from 34.8% in 1Q26), while Wi-Fi 6E held 16.9%. Both previous-generation standards remain relevant in phased enterprise rollouts and mid-market deployments. In new projects, though, Wi-Fi 6/6E investment has largely given way to Wi-Fi 7.
  • Regional performance: Growth was broad-based across all three regions in 2Q26. EMEA led with 32.2% YoY growth, reaching $1.0B supported by enterprise refresh investment and expanding Wi-Fi 7 adoption across Western and Central Europe. The Americas grew 21.6% YoY to $1.5B, maintaining its position as the largest regional market. APJ expanded 15.2% YoY to $708.1 million.

Vendor highlights

The 2Q26 vendor field reflects a market in active expansion, with the top five vendors posting revenue growth.

Cisco: Cisco posted $1.3B in enterprise WLAN revenues in 2Q26, growing 27.2% YoY and maintaining its position as the market share leader with a 39.0% share. Cisco’s growth reflects enterprise demand across its Wi-Fi 7 portfolio and continued momentum in large campus and branch deployments. Cisco’s scale and long-standing enterprise relationships keep it entrenched in complex, multi-site deployments, backed by a go-to-market channel that’s hard for smaller vendors to match.

HPE/Juniper: The combined HPE and Juniper entity posted $557.2 million in enterprise WLAN revenues in 2Q26, growing 7.5% YoY with a 17.2% market share. While the growth rate is more moderate than its peers this quarter, HPE’s Aruba and Juniper Mist AI-driven platforms remain the pick for enterprises that prioritize AIOps and cloud-managed deployments, particularly those consolidating wired and wireless management under one roof.

Ubiquiti: Ubiquiti posted $415.9 million in 2Q26 revenues, growing 33.1% YoY with a 12.8% market share. Its continued above-market growth reflects traction in the mid-market and among managed service providers, where the company’s competitive pricing and rapid Wi-Fi 7 product refresh are leading to consistent revenue momentum.

Huawei: Huawei posted $339.7 million in 2Q26 revenues, growing 44.0% YoY and reaching a 10.5% market share, up from 6.0% in 1Q26. Growth was driven by its Wi-Fi 7 campus portfolio and integrated campus networking solutions, with standout performance in markets across Asia Pacific and EMEA where Huawei holds established enterprise customer relationships.

Vistance Networks: Vistance Networks (formerly CommScope/Ruckus) posted $107.2 million in 2Q26, growing 9.9% YoY with a 3.3% market share. The Ruckus portfolio continues to hold its position in high-density verticals including hospitality, education, and large venues, where its enterprise-grade quality and deployment flexibility remain competitive differentiators. In April 2026, Belden announced its intent to acquire Ruckus Networks from Vistance Networks, a $1.85B deal that closed in July 2026.

WLAN Top Companies Chart

Market dynamics

Wi-Fi 7 as the new enterprise baseline

The 2Q26 results confirm that Wi-Fi 7 is no longer a premium upgrade choice, rather it has become the default selection for enterprise wireless procurement. The speed and breadth of this transition is driven by a combination of factors: a broad hardware refresh cycle that has created natural replacement demand across installed Wi-Fi 5 and early Wi-Fi 6 deployments; a matured vendor product portfolio that has brought Wi-Fi 7 to competitive price points across all market tiers; and the pull-forward effect of enterprise AI adoption, which is raising throughput and latency requirements across office environments, campuses, and branch sites.

Related: Watch IDC’s take on what’s driving the shift in The Rise of Wi-Fi 7 in Enterprises.

Memory Constraints Strain WLAN Economics

Persistent supply chain headwinds caused by industry-wide memory shortages continue to extend lead times and increase average selling prices (ASPs) across the enterprise WLAN market, forcing enterprise buyers into difficult trade-offs. Organizations are choosing between accelerating purchases to secure inventory or deferring deployments to manage costs, reshaping buying patterns as cost-conscious enterprises prioritize strategic deployments while others absorb premium pricing.

“

Strong 2Q26 results in the enterprise WLAN market underscore a market in full transition. The campus refresh cycle is accelerating across regions, driven by the convergence of Wi-Fi 7, multi-gigabit switching, and AI adoption. Organizations are modernizing networks to support AI workloads while simultaneously leveraging AI and agentic capabilities to streamline engineering and operations. Despite supply chain headwinds, IDC expects momentum in the enterprise wireless industry to continue as organizations across the globe prioritize network modernization in the AI era.

— Brandon Butler, Senior Research Manager, Network Infrastructure & Services, IDC

Why it matters

  • Who should care? CIOs, network architects, and IT procurement teams making refresh decisions in the next 12-18 months should treat Wi-Fi 7 as the standard starting point, not an optional upgrade. The market has moved: vendors are shifting development and supply chain focus to Wi-Fi 7, and the price premium over Wi-Fi 6 is narrowing rapidly. Deferring Wi-Fi 7 now means retrofitting networks to meet AI application requirements sooner than expected.
  • Business impact: The acceleration in enterprise WLAN growth, 23.2% YoY, up from 15.6% in the prior quarter, reflects real enterprise budget commitment to wireless modernization. Organizations that have invested in Wi-Fi 7 infrastructure are building the connectivity foundation for AI-powered collaboration, real-time location services, and high-density mobile workloads. The TCO calculus increasingly favors Wi-Fi 7 over incremental Wi-Fi 6E upgrades.

What’s next for the WLAN market

IDC expects the enterprise WLAN market to sustain growth through the second half of 2026, with Wi-Fi 7 continuing to consolidate its dominant position, despite supply chain headwinds. As the enterprise installed base of Wi-Fi 6 and 6E access points continues to mature, the addressable refresh opportunity remains substantial. Demand from AI-intensive applications (spanning inference at the edge, high-density video, and IoT integration) will continue to pull forward network investment decisions. Integrated, secure networking is another key driver in the refresh opportunity.

The competitive dynamics established in 2Q26 are likely to persist. Cisco’s scale advantage in large enterprises is durable, but Huawei’s trajectory and Ubiquiti’s mid-market momentum mean that market share will remain actively contested. Macro risks, including regional economic uncertainty and supply chain disruptions, are real watch items for the back half of the year. None of them have shown up yet in the refresh demand IDC is tracking.

Brandon Butler

Brandon Butler - Senior Research Manager, Networking and Infrastructure Services, Enterprise Infrastructure

Brandon Butler is a Senior Research Manager within IDC’s enterprise infrastructure global research domain and part of the networking infrastructure and services subdomain. His research covers market and technology trends, forecasts, and competitive analysis in enterprise campus, branch, and edge…
Petr Jirovsky

Petr Jirovsky - Senior Research Director, Networking and Infrastructure Services, Enterprise Infrastructure

Petr Jirovsky is a Senior Research Director within IDC’s enterprise infrastructure global research domain and part of the Networking and Infrastructure Services subdomain. He provides quantitative insights on network infrastructure for the datacenter, cloud, and campus/branch environments. He serves as…
Diego Anesini

Diego Anesini - VP Data and Analytics, Networking

Diego Anesini serves as Vice-President, Data & Analytics, Networking. Prior to this position, Diego held various roles in the company. The most recent was VP, Data & Analytics for Latin America. He has extensive experience in the Networking, Telecom and…

The AI line item on this quarter’s cloud invoice doesn’t match anything in the forecast tab. Six months ago it was a rounding error. Now it’s the fastest-growing number in the budget, and finance, IT, and the vendor each have a different answer for who owns it.

What is token economics, and why is it suddenly a CFO problem?

Token economics, or “Tokenomics,” is the financial discipline of measuring, benchmarking, and governing what an enterprise pays per unit of AI inference (the token), instead of treating AI spend as an extension of software licensing. This year, the Linux Foundation formalized the discipline by launching the Tokenomics Foundation, with founding support from Google Cloud, IBM, Microsoft, SAP, Accenture, and JPMorganChase. A dozen of the world’s largest technology and financial institutions agreeing to standardize how AI cost gets measured is itself the signal: AI spend had gotten too complicated to track the old way.

Why AI costs don’t behave like software licensing

A seat count is predictable. A token count is not. It moves with every prompt, every agent reasoning step, and every tool call an application makes on a user’s behalf, and it can double inside a single product decision an engineering team makes without ever looping in finance. IDC research puts a number on how unevenly that cost lands: output tokens run 3 to 5 times more expensive than input tokens, and a multiagent pipeline that isn’t monitoring its input-to-output ratio can understate its true inference cost by 3x or more. Two enterprises already know what that miscalculation costs in dollars: one exhausted an entire year’s AI budget by April after rolling out a coding assistant at scale, and a hospital system logged more than $6 million in unplanned charges before its finance team traced the source.

Who actually owns the AI budget line?

The deeper problem isn’t the invoice. Only one in five CEOs have created a separate AI budget line in the first place, which means for most enterprises this spend is still buried inside a budget that was never built to isolate it. CFOs now influence more than two-thirds of enterprise technology investment decisions, while CIOs remain essential for the technical build. That’s two roles with converging influence and a mandate that hasn’t caught up. Nearly three in four organizations already name excessive AI spending a major risk to their future technology investment plans.

“

Every dollar of wasted AI agent spend is a governance failure.

— Shari Lava, Group VP of AI, IDC

Eighteen months ago, that framing would have stayed inside IT. Now it’s pushing the ownership question into board-level conversations, next to the AI budget line itself.

What CFOs can do now: Building a full-stack token cost model

The starting point is visibility, not restriction. A full-stack token cost model — compute, storage, networking, power, cooling, and facilities, expressed per million tokens by workload — is the analytical foundation every AI infrastructure and purchasing decision now depends on. IDC research shows that routing tokens to right-sized models, rather than defaulting every workload to the largest frontier model available, cuts cost per token by 30 to 60 percent with no new hardware investment. That’s the shift worth pushing for this budget cycle: a defined per-million-token cost figure attached to every new AI request before it reaches sign-off.

  • Ask engineering for input-to-output token ratios by workload before the next planning cycle closes.
  • Require any new AI deployment request to show a per-million-token cost estimate, the same way a seat-based software request shows per-seat pricing.
  • Put the ownership question on the agenda directly. CFOs demanding embedded governance, modular architecture, and real-time cost visibility from vendors are already ahead of most of the market.

What to expect new

Expect the CFO-CIO ownership question to formalize rather than resolve itself quietly: joint AI-FinOps governance structures, full-stack token cost modeling required before any new infrastructure commitment, and CFOs setting vendor selection criteria that used to belong to IT alone. The enterprises moving on this now are building that model before the FY27 budget cycle locks. Everyone else is having the ownership argument for the first time, mid-budget-season, with finance and IT starting from different numbers.

Ryan Smith - Content Marketing Director - IDC

Ryan Smith is the Director of Content Marketing at IDC, where he leads brand-level content and social media strategy, aligning research insights with compelling storytelling to engage technology decision-makers. With a background in both IT and marketing, Ryan brings a unique blend of technical understanding and creative strategy to his work. He’s also a seasoned storyteller, speaker, and podcast host who believes the right message, told the right way, can drive both trust and transformation.

腕戴产品增长逐渐放缓后,厂商对下一轮增量开始两种方向上的探索:向上,通过AI提升单品价值;向外,通过新形态拓展用户边界。——本文基于IDC最新发布的《全球可穿戴设备市场季度跟踪报告》聚焦2026年第二季度全球腕戴市场中智能手表端侧AI算力与无屏手环两大热点,进一步探讨AI能否创造新的换机价值,以及无屏形态能否拓展新的用户增量。

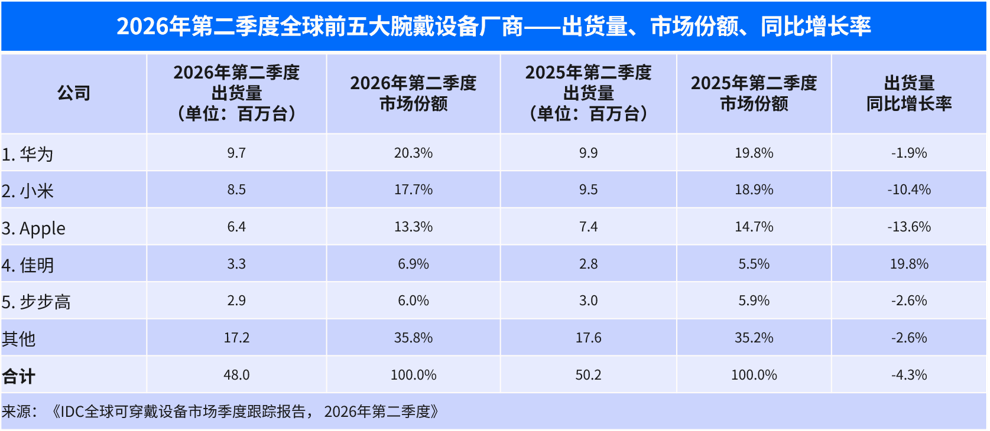
根据国际数据公司(IDC)最新发布的《全球可穿戴设备市场季度跟踪报告》,2026年第二季度全球腕戴设备市场出货量为4,801万台,同比下滑4.3%。腕戴设备市场包含智能手表和手环产品。其中,全球智能手表市场出货量3,708万台,同比下滑4.2%。手环市场出货量1,092万台,同比下滑4.7%。智能手表真的迎来端侧算力AI时代了吗?无屏手环市场是不是腕戴新风向?本文将为您一一解读。

智能手表迎来端侧算力AI时代?

过去智能手表的AI能力主要依赖手机协同与云端大模型,手表更多承担数据采集、语音入口和结果呈现。随着高通今年3月发布旗下首款集成NPU的可穿戴平台Snapdragon Wear Elite,AI芯片正逐步成为智能手表提升端侧AI能力的重要硬件基础。目前,头部厂商已开始布局不同层级的AI算力方案,从通用AI算力中枢到面向特定功能的轻量AI引擎,推动AI能力进一步向手表端侧下沉。

其中,具备通用AI算力中枢的芯片更有潜力承担整机系统级AI任务调度。相比依赖手机或云端,端侧AI不仅能够带来更低的响应延迟和更高的能效,也能够减少敏感数据上传,提升隐私性,并结合心率、睡眠、运动等多维传感器数据,实现更加持续的用户状态感知。同时,更强的端侧算力能够支持更复杂的AI模型,使手表从简单的指令识别和数据分析,进一步向上下文乃至环境理解、用户意图识别以及多维数据综合判断演进。

硬件能力已经开始为智能手表的AI升级铺路,但AI能否真正成为推动市场增长的新动力,最终仍取决于其能否从“功能增强”走向“高价值场景创造”。 当前AI在智能手表上的应用仍面临场景有限、交互方式和模型能力受限等挑战,未来只有形成足够高频、刚需且区别于手机的AI体验,才能真正转化为智能手表市场的新增量。

无屏产品成为新风向?

Whoop凭借订阅服务模式实现快速增长,引发市场关注。与此同时,无屏手环和智能戒指也成为近期可穿戴市场中快速发展的无屏设备形态,无感无干扰、轻量化和长续航逐渐成为部分用户的新需求。随着更多厂商进入,无屏手环能否从细分市场走向大众?

从目前来看,无屏手环仍具备进一步发展的潜力,有望成为腕戴市场的重要补充,尤其适合对无干扰佩戴、轻量化和长续航有进阶需求的用户。但这类产品的核心价值高度依赖软件算法、数据分析和持续服务,成本并不局限于硬件本身。无论采用一次性硬件销售还是付费订阅模式,短期内都难以取代传统手环,成为面向大众入门市场的主流产品。

与此同时,Whoop的订阅模式也并非无屏手环的必然商业模式,其适用性取决于厂商自身的产品基因、健康算法与数据积累、软件服务能力以及既有商业模式。 对于具备健康数据和软件服务优势的厂商,订阅模式能够通过持续服务创造长期收入;而对于以硬件销售或生态导流为核心的厂商,一次性硬件销售可能反而更符合其用户基础和商业模式。

2026年二季度全球腕戴市场Top 5厂商表现

华为

2026年二季度华为腕戴产品全球出货量持续领跑。华为持续迭代Watch Fit系列,Fit 5系列聚焦轻量时尚与进阶运动健康,成为二季度增长的重要支撑。同时,HUAWEI WATCH Ultimate Design星钻绽放款、儿童手表X1/X1 Pro等新品密集推出,覆盖多元细分市场,通过产品线扩张与人群细分进一步巩固腕戴市场竞争力。

小米

2026年二季度小米加速腕戴产品结构向上升级,手环端小米手环10 Pro成为产品线升级的重要助力;手表端Redmi Watch稳住大众市场基本盘,Xiaomi Watch S5系列出货持续攀升,全智能手表5则进一步补强高端市场,推动腕戴业务由规模覆盖向产品结构升级延伸。

Apple

2026年二季度Apple Watch进入更大范围的促销阶段,价格刺激成为成熟市场维持增长的重要手段。除中国市场在618年中大促中保持较好表现外,日本及拉美等市场也受益于零售及渠道促销实现增长,Apple Watch在成熟市场增长承压的同时,仍通过价格策略和区域市场拓展挖掘增量。

佳明

佳明2026年二季度推出Forerunner 70和170系列新品,进一步强化跑步等专业运动领域布局,同时向日常健康、户外及多运动场景拓展。通过新品迭代完善不同价位和人群覆盖,佳明在巩固专业运动优势的同时,持续拓展腕戴市场用户边界。

步步高

步步高以中国市场为核心,在儿童手表领域持续保持领先。2026年二季度推出旗舰Z12及Z9A等新品,进一步强化中高端市场布局;同时依托imoo品牌积极拓展东南亚、欧洲等海外市场,在巩固国内优势的同时加速全球化布局。

小结:市场下滑背后的结构性转折

2026 年第二季度乃至 2026 年下半年,腕戴设备市场增长依旧承压。过去几年拉动行业高速扩张的三重增长引擎 —— 新用户首购红利、产品迭代驱动的换机周期、价格下沉带来的市场扩容 —— 均已步入增速放缓阶段。当前行业正沿着两大方向寻求突破:其一,依托端侧 AI 算力加持,强化设备实时感知与主动决策能力,推动智能手表升级为个人健康管理的智能中枢。不过这套健康场景的商业化价值仍有待进一步验证,血糖等多元化体征监测功能落地,有望持续拉动用户实际使用需求。其二,行业在无感化交互与产品形态上持续创新,最大限度弱化穿戴设备的物理佩戴存在感,转而依靠持续输出的数据价值建立用户粘性。综合来看,下一阶段市场竞争的核心逻辑,将落脚于产品价值的全面重构。

IDC观点及未来展望

IDC认为,腕戴市场下一轮增长不会由单一硬件创新驱动,而将取决于厂商能否将硬件能力转化为真实的用户价值。AI芯片可以解决智能手表“能否具备更强AI能力”的问题,而高价值场景才能真正解决“用户是否愿意为AI换表”的问题。无屏手环则更可能作为传统腕戴的增量补充,满足细分用户对无干扰、轻量和长续航的需求。因此,厂商无需盲目复制AI手表、无屏手环或订阅模式,应根据自身优势选择增长方向:有硬件与生态优势的厂商应优先挖掘AI带来的换机价值;有健康数据与算法积累的厂商可进一步布局无屏设备和持续服务;而以硬件规模见长的厂商,则应谨慎引入需要长期运营的订阅模式。

延伸阅读与沟通:

进一步交流

本文数据与观点基于IDC《全球可穿戴设备市场季度跟踪报告》(2026Q2)。如需获取完整报告,或针对贵品牌的具体市场定位、产品策略进行定制化分析,欢迎扫描下方二维码与IDC联系。我们将根据您的业务场景,提供从市场数据、竞争格局到用户洞察的专属解决方案。请点击此处与我们联系。

Sophie Pan

Sophie Pan - Research Director, Client System Research

Sophie Pan is a research director for the Client Systems Research team at IDC China. She is responsible for emerging technology device research, including wearable devices and smart home devices. Sophie has a deep understanding of the landscape and ecosystem…