Worldwide Smartphone Market Grows 3.5% in Q3 2025 and is projected to grow by 1.5% for the full year, As Upgrades Accelerate, Driven by New Innovative Products and Boosted by Record Apple Shipments in 2025, According to IDC
According to historical data from the International Data Corporation (IDC) Worldwide Quarterly Mobile Phone Tracker, global smartphone shipments increased 3.5% year-over-year (YoY) to 325.7 million units in the third quarter of 2025 (3Q25). The smartphone market continued its recovery, fueled by the premium segment as consumers upgraded to the latest devices, attracted by innovative form factors and more affordable AI-enabled smartphones.
“The smartphone industry continues its upward trajectory, posting solid growth – a remarkable achievement given persistent economic uncertainty and tumultuous tariff dynamics”, said Nabila Popal, senior research director for Worldwide Client Devices, IDC. “OEMs have mastered the art of innovation not only in hardware and software to entice upgrades but also in removing purchase friction. They have flawlessly combined cutting-edge devices with innovative financing models and aggressive trade-in programs that make the upgrading decision a “no brainer” for consumers”.
“Despite economic uncertainty, the smartphone market showed resilience. Apple and Samsung posted strong results as their latest devices encouraged consumers to upgrade in the premium segment, while new, affordable AI-enabled smartphones also drove high upgrades in more affordable price categories”, said Francisco Jeronimo, vice president, Client Devices, IDC. “Apple delivered its best results ever in a July quarter, while Samsung achieved its strongest July-quarter growth on record. Demand for Apple’s new iPhone 17 lineup was robust, with pre-orders surpassing those of the previous generation. At the same time, Samsung’s Galaxy Z Fold 7 and Galaxy Z Flip 7 outperformed all earlier foldable models, creating renewed momentum for the foldables segment.”
Beyond the top two vendors, Xiaomi, Transsion, and vivo also recorded notable growth during the quarter. Xiaomi consolidated its recovery in Europe and Latin America, leveraging its Redmi Note and Poco series. Transsion continued to expand rapidly across North and East Africa, benefiting from strong distribution networks and a competitive portfolio in the sub-$200 segment. Vivo regained share in several emerging markets, supported by refreshed midrange devices with AI-enhanced imaging features and aggressive online promotions.
“Looking ahead, IDC maintains a positive outlook for 2025, anticipating that market momentum will continue through the final quarter of the year,” said Anthony Scarsella, research director for Mobile Phones at IDC. “The accelerated demand for the latest AI-enabled products is expected to lead to a strong finish for 2025, driven by aggressive pricing promotions and robust product portfolios from leading vendors.”
Top 5 Companies, Worldwide Smartphone Shipments, Market Share, and Year-Over-Year Growth, Q3 2025
(Preliminary results, shipments in millions of units)
| Company | 3Q25 Shipments | 3Q25 Market Share | 3Q24 Shipments | 3Q24 Market Share | Year-Over-Year Change |
| 1. Samsung | 61.4 | 18.8% | 57.7 | 18.3% | 6.3% |
| 2. Apple | 59.4 | 18.2% | 57.1 | 18.1% | 4.1% |
| 3. Xiaomi | 43.4 | 13.3% | 42.8 | 13.6% | 1.4% |
| 4. Transsion | 29.2 | 9.0% | 25.7 | 8.2% | 13.4% |
| 5. vivo | 27.9 | 8.6% | 27.0 | 8.6% | 3.4% |
| Others | 104.5 | 32.1% | 104.5 | 33.2% | 0.0% |
| Total | 325.7 | 100.0% | 314.7 | 100.0% | 3.5% |
| Source: IDC Worldwide Quarterly Mobile Phone Tracker, November 6, 2025 | |||||
Table Notes:
- Company shipments are branded device shipments and exclude OEM sales for all vendors.
- The “Company” represents the current parent company (or holding company) for all brands owned and operated as a subsidiary.
- Figures represent new shipments only and exclude refurbished units.
- IDC declares a statistical tie in the Smartphone market when there is a difference of one-tenth of one percent (0.1%) or less in the shipment shares among two or more companies.
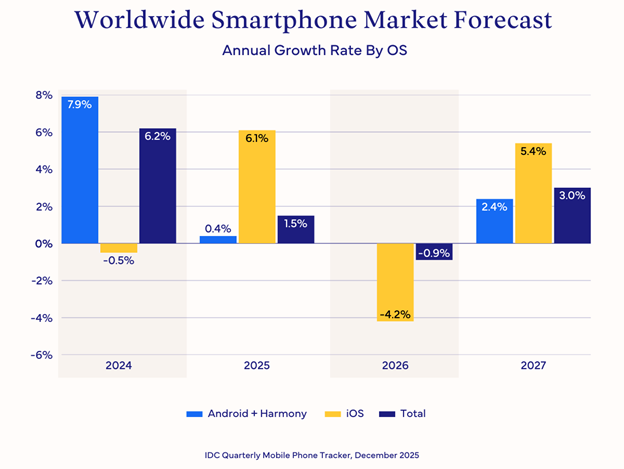
Worldwide smartphone shipments are forecast to grow 1.5% year-on-year (YoY) in 2025 to 1.25 billion units, according to the International Data Corporation (IDC) Worldwide Quarterly Mobile Phone Tracker. This is an increase from 1% growth in prior forecast, primarily driven by accelerated performance from Apple in the holiday quarter, rapid growth in key emerging markets and stabilization in China. Apple’s shipments are forecast to grow 6.1% YoY in 2025, up sharply from 3.9% in the last cycle.
“Apple is set to have a record year in 2025 with shipments forecast to cross 247 million units, thanks to the phenomenal success of its latest iPhone 17 series,” said Nabila Popal, senior research director with IDC’s Worldwide Quarterly Mobile Phone Tracker. “In China, Apple’s largest market, massive demand for iPhone 17 has significantly accelerated Apple’s performance. It ranked first in October and November per IDC’s China Monthly Sales data with more than 20% share, miles ahead of the competition, leading IDC to revise Apple’s Q4 forecast in China from 9% to 17% YoY. This turns a previously projected 1% decline in China for 2025 into a positive 3% growth, that’s a phenomenal turnaround. The success story is replicated across all regions, including the US and Western Europe that had previously slowed down. This calendar year will not only be a record period for Apple in terms of shipments but also in value, which is forecast to exceed $261 billion, with 7.2% YoY growth in 2025.”
While the near-term forecast for smartphones has strengthened, 2026 growth has been revised downward from 1.2% growth to 0.9% decline, due to a combination of component shortages and product cycle adjustments. Apple’s strategic shift of its next base iPhone model from fall 2026 to early 2027 is forecast to pull-down iOS shipments by 4.2% next year. Furthermore, the ongoing global memory shortage is expected to constrain supply and raise prices, which will impact low-to-mid range Android devices more significantly as they remain more price sensitive. As a result, smartphone units will face a soft decline in 2026, however ASP will increase to $465, propelling the market to its record high value of $578.9 billion.
“As memory components become more limited and more expensive, manufacturers face increasing pressure to raise prices,” said Anthony Scarsella, research director with IDC’s Worldwide Quarterly Mobile Phone Tracker. “Vendors need to adopt different strategies to protect their market share. While some OEMs will inevitably be forced to raise prices, others will adjust their portfolio towards pricier models with higher margins to absorb some of the memory impact on BOM. Next year will be a challenging time for the industry, however, IDC still believes the market could see record ASPs.”
About IDC Trackers
IDC Tracker products provide accurate and timely market size, vendor share, and forecasts for hundreds of technology markets from more than 100 countries around the globe. Using proprietary tools and research processes, IDC’s Trackers are updated on a semiannual, quarterly, and monthly basis. Tracker results are delivered to clients in user-friendly Excel deliverables and on-line query tools.
For more information about IDC’s Worldwide Quarterly Mobile Phone Tracker, please contact Jackie Kliem at 508-988-7984 and jkliem@idc.com.
Click here to learn about IDC’s full suite of data products and how you can leverage them to grow your business.
About IDC
International Data Corporation (IDC) is the premier global provider of market intelligence, advisory services, and events for the information technology, telecommunications, and consumer technology markets. With more than 1,300 analysts worldwide, IDC offers global, regional, and local expertise on technology, IT benchmarking and sourcing, and industry opportunities and trends in over 110 countries. IDC’s analysis and insight helps IT professionals, business executives, and the investment community to make fact-based technology decisions and to achieve their key business objectives. Founded in 1964, IDC is the world’s leading tech media, data, and marketing services company. To learn more about IDC, please visit www.idc.com. Follow IDC on Twitter at @IDC and LinkedIn. Subscribe to the IDC Blog for industry news and insights.
All product and company names may be trademarks or registered trademarks of their respective holders.
Contacts:
Escalate PR for IDC
IDC@escalatePR.com
Nabila Popal
npopal@idc.com
+1 571-373-1816
Francisco Jeronimo
fjeronimo@idc.com
+44 77 9630 1919
Anthony Scarsella
ascarsella@idc.com
+1 508-308-3301