Help Center

Watch Training Videos

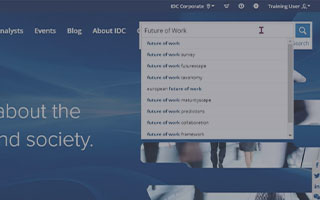
  • Searching on IDC.com

    Learn how to use our basic and advanced search functionality to find relevant research, and how to save your search results with custom alerts.

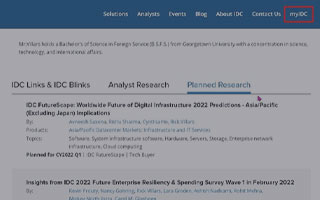
  • Accessing Planned Research

    The planned research section lets you look ahead to upcoming research. Learn the various ways you can access planned research as well as how to filter and export your results.

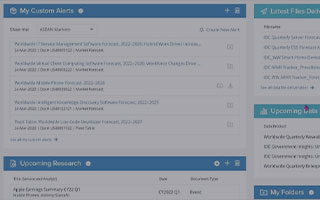
  • How to Utilize the myIDC Dashboard

    The myIDC Dashboard offers a consolidated view of your entire subscription. Learn about creating alerts and folders, following analysts, finding your upcoming research, and more.

  • Overview

    The IDC Spending Guide Query Tool is a powerful, user friendly analytical platform that allows you to interact with your data. You will use a visual interface to uncover the trends in evolving technology markets.

  • Info

    View Only tab for Black Book or Spending Guide data that provides key product data including: product release updates, product market overviews, Press Releases, Query Tool enhancements, Downloads, Subscription Details, Delivery Schedules, Taxonomy Documents, Exchange Rates, and more.

  • View

    To assist you in displaying Black Book or Spending Guide data visually. It allows clients to use the View tab to create interactive charts, graphs and dashboards while filtering on dataset, data attributes, timeframe and measures.

  • Query

    Clients leverage the Query tab as a way to create, save and share custom-built Black Book or Spending Guide queries. You may analyze datasets by applying filters, measures, multiple currencies, sorting, ranking and exporting tables (all specific to the dimensions in the clients contract).

  • Export

    Utilize the export tab when clients need to create, save, share and export larger Black Book or Spending Guide data sets to download and open on your desktop use the Export tab. This allows you the ability to filter and select needed data attributes, measures and currencies.

  • Overview

    The IDC Tracker Query Tool is a powerful, user friendly analytical platform that allows you to interact with your data. You will use a visual interface to uncover the trends in evolving technology markets.

  • Info

    You will find product market overviews all in one place on the Info tab including Tracker Updates, Press Releases, Downloads, Subscription Details, Delivery Schedules, Taxonomy Documents, Exchange Rates, and more.

  • View

    To assist you in displaying Tracker data visually you can use the View tab to create interactive charts, graphs and dashboards while filtering on dataset, data attributes, timeframe and measures.

  • Query

    You can use the Query tab as a way to create, save and share custom-built Tracker queries. You may analyze datasets by applying filters, measures, multiple currencies, sorting, ranking and exporting tables.

  • Export

    When you need to create, save, share and export larger Tracker data sets to download and open on your desktop use the Export tab. This allows you the ability to filter and select needed data attributes, measures and currencies.

  • Getting Started with Company Lens

    There is a lot to see in Company Lens. This video helps you get oriented. It covers the major sections, what they contain, and the basics of switching between them.

  • The Explore Tab of Company Lens

    Explore is like a customizable dashboard. This video provides an overview of how to configure Explore for your markets. It helps you keep an eye on the competition, largest buyers, and the nature of the partner network.

  • The Search Tab of Company Lens

    Search is where you will probably spend most of your time in Company Lens. This video introduces you the fields, clicks, and tricks to get the information you’re after as fast as possible.

  • CSV to Pivot Table

    To assist you in creating an Excel pivot table from a CSV flat file. These steps are particularly useful when the CSV flat file exceeds the approximately 1 million row viewing limit of Excel. The steps seen in the video are for a small amount of data, processing a larger file will take a few minutes.