Samsung and Apple Grew in Q1 2026 As the Global Smartphone Shipments Declines 2.9% amid memory constraints, according to IDC
Limited memory supply and record high memory prices increase pressure on smartphone OEMs to reduce shipments and increase prices that dampen demand
NEEDHAM, Mass., June 23, 2026 – According to final historical data from the International Data Corporation (IDC) Worldwide Quarterly Mobile Phone Tracker, global smartphone shipments decreased 2.9% year-over-year (YoY) to 293.8 million units in the first quarter of 2026 (1Q26). This broke the 10 consecutive growth streak that the market had seen since mid 2023. We expect the first quarter slowdown to be a mild precursor for what lies ahead in 2026 as the supply constraints around memory and price increases further dampen the market growth.
“The smartphone market has entered one of its most challenging periods, driven by acute memory supply constraints that are directly impacting both shipments and demand,” said Nabila Popal, senior research director for Worldwide Consumer Devices, IDC. “Limited memory availability is forcing shipment reductions, while sharply higher memory prices are pushing up bill‑of‑materials cost and forcing price hikes by many top brands. In several emerging markets, prices have risen by as much as 40–50%, significantly weighing on demand in price‑sensitive regions. OEMs are responding with tighter cost controls, reduced marketing and channel support, and increased use of despecing strategies – but such measures also limit growth. 2026 represents a critical inflection point for vendors to reinvent themselves as rising component, energy, and logistics costs due to the recent war in the Middle East compound downside risks on the market outlook and pressure global smartphone demand.”
Who were the Top 5 Smartphone Companies in Q1 2026?
Despite the current market challenges, Samsung and Apple – the two leading companies, were also the only two companies in the global top 5 to register a YoY growth. Their strong focus on premium and higher leverage with memory suppliers has them better positioned them to manage this crisis and gain market share. As the smartphone market shifts towards higher price points to offset increasing BOM costs, all vendors continue to face intense pressure, especially the ones with higher exposure to low-end devices. Despite this, Xiaomi, OPPO and vivo largely retained their market positions this quarter, with only marginal share losses.
- Samsung reclaimed the top position in Q1 2026, primarily due to strong demand for the new Galaxy S26 Ultra. This led to a 2.9% YoY increase in shipments compared to the previous year, despite the later launch. The Ultra’s performance was enhanced by its consistent pricing compared to its predecessor. Additionally, the earlier release of the mid-range A-Series helped fill volume gaps from the S26’s later arrival and drive growth.
- Apple secured second place, driven by the strong performance of the iPhone 17 series, which saw significant growth in China of over 30%. This led to a 4.4% year-over-year increase in global sales for Q1. Although demand remains robust, supply disruptions and a reduction in channel support in some key markets have hindered growth.
- For the Chinese vendors, it was a mixed bag as some doubled down on their efforts in the Chinese market while others focused outside China amid the intense competition in the home market.
- Xiaomi came in third for the quarter, maintaining its third position despite the steepest decline among the top 5 players, as it strategically reduced shipments of older models to avoid large scale price hikes.
- OPPO placed fourth as it integrated with realme, with stronger performance in China than international markets helping offset a larger decline globally.
- vivo achieved the fifth spot, closing its gap with OPPO on the global stage, driven by positive performance in China – its largest market – and maintaining leadership position in India.
- Outside the Top 5, companies like Honor, Lenovo and Huawei also saw positive growth with Honor having the highest amongst the Top 10 of 24.9% YoY, as it shifted focus to overseas expansion.
How is the Smartphone Market Adapting?
“This was a challenging quarter for all smartphone players as they figure out a balance between profitability and growth and stabilization within home markets vs overseas expansion amid the constrained supplies and price pressure. Apple and Samsung benefited from their dominance in the premium segment where they strategically held back price increases, while others such as Xiaomi, OPPO, and vivo made concerted efforts to shift share to higher price bands,” said Kiranjeet Kaur, Associate Director of Consumer Devices, IDC. “Their resilience will continue to be tested over the next few quarters as they optimize and streamline their portfolio and respond with agility to market and supply chain changes. The strong footprint they had in Asia will be challenged as the low-end segment is eroded due to the price increases while expansion in Europe will face increasing competition from Apple and Samsung.”
What is the Market Outlook?
“The 2.9% decline in the market is just a sample of what’s to come as the memory situation intensifies on all fronts”, said Anthony Scarsella, research director for Mobile Phones, IDC. “Developed markets like the US that focus on premium models and with incentives such as trade-in and financing will be less susceptible to the overall impact of price increases. However, emerging markets that focus on sub-$200 devices will offer consumers very few options as the growing cost of memory components will represent a larger challenge than what the pandemic delivered over five years ago.”
Despite the negative shipment outlook, the market is moving towards higher ASPs due to rising costs and strategic shifts in vendor portfolios towards higher product mix. The premiumization trend will continue even as the memory prices are expected to stabilize by the second half of 2027.
Top 5 Companies, Worldwide Smartphone Shipments, Market Share, and Year-Over-Year Growth, Q1 2026 (Top 5 Companies, Worldwide Smartphone Shipments, Market Share, and Year-Over-Year Growth, Q1 2026 )
| Company | 1Q26 Shipments | 1Q26 Market Share | 1Q25 Shipments | 1Q25 Market Share | Year-Over-Year Change |
| Samsung | 62.4 | 21.2% | 60.6 | 20.0% | 2.9% |
| Apple | 61.8 | 21.0% | 59.1 | 19.5% | 4.4% |
| Xiaomi | 33.8 | 11.5% | 41.8 | 13.8% | -19.1% |
| OPPO | 30.7 | 10.5% | 34.1 | 11.3% | -9.9% |
| vivo | 21.2 | 7.2% | 22.7 | 7.5% | -6.9% |
| Others | 84.0 | 28.6% | 84.3 | 27.8% | -0.3% |
| Total | 293.8 | 100.0% | 302.6 | 100.0% | -2.9% |
| Source: IDC Quarterly Mobile Phone Tracker, May 7, 2026 | |||||
- Company shipments are branded device shipments and exclude OEM sales for all vendors.
- The “Company” represents the current parent company (or holding company) for all brands owned and operated as a subsidiary.
- Figures represent new shipments only and exclude refurbished units.
- *IDC declares a statistical tie in the Smartphone market when there is a difference of one-tenth of one percent (0.1%) or less in the shipment shares among two or more companies.
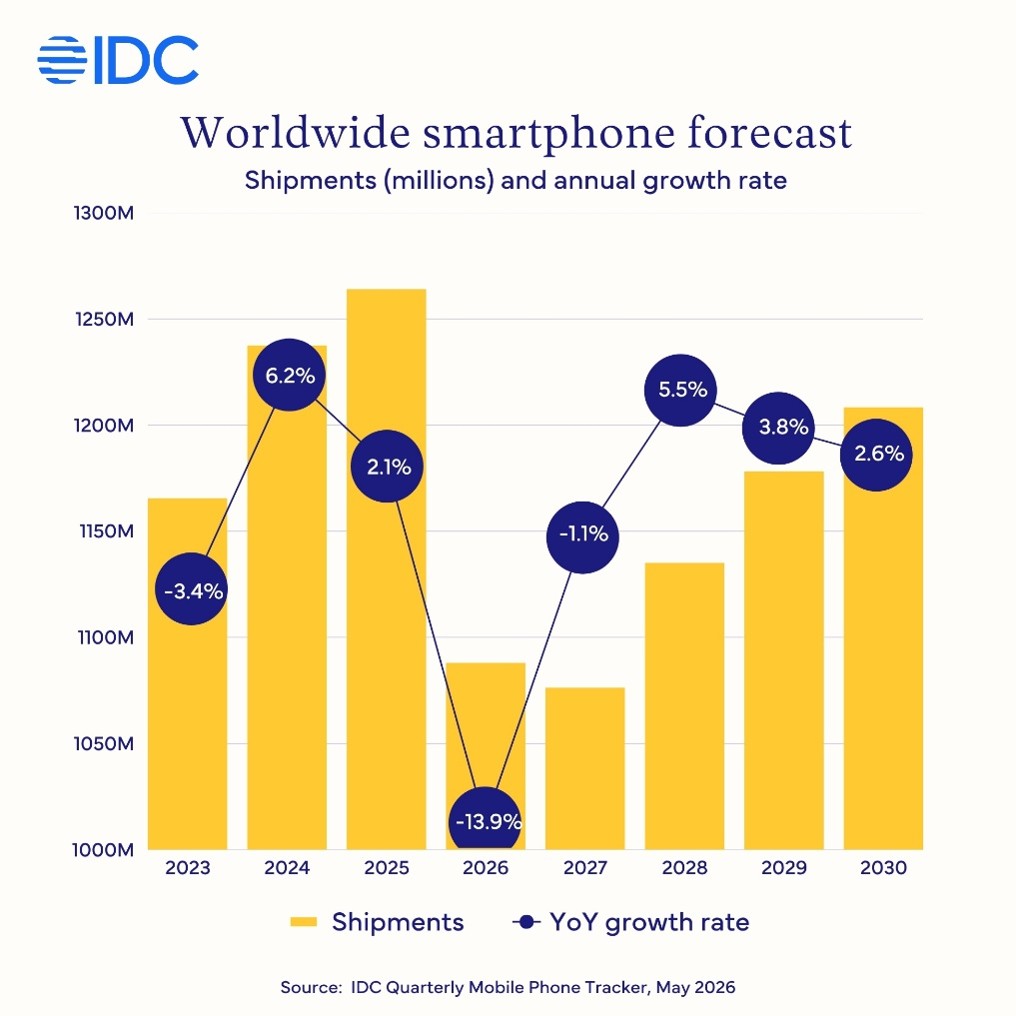
Worldwide smartphone shipments are forecast to decline 13.9% year-on-year in 2026 to 1.09 billion units, according to the International Data Corporation (IDC) Worldwide Quarterly Mobile Phone Tracker. This is a further downward revision from IDC’s previous forecast of a 12.9% decline issued in February, and would mark the steepest annual contraction in smartphone history. A second consecutive decline of 1.1% is now expected in 2027, with a 5.5% rebound expected in 2028 as memory supply normalises.
Why will the smartphone market witness a record decline this year?
“The deepening memory shortage crisis remains the dominant force behind the record 14% drop this year, but it is no longer the only one.” said Nabila Popal, senior research director with IDC’s Worldwide Quarterly Mobile Phone Tracker. “The US-Iran war has added a fresh layer of cost pressure for smartphone OEMs, driven by rising oil prices and transportation costs. Combined, these pressures are compelling vendors to reduce shipments, raise prices and concentrate on higher price tiers – elevating smartphone ASP to a record $550, up $100 from last year. 2026 will be a defining year for the industry as new reality of structurally higher costs take hold. For consumers, it means the era of ultra cheap smartphones is over. For vendors, it means only those that can adapt their strategies to this new cost environment and sustain demand at elevated price points will survive.”
How will the different regions perform in 2026?
The decline will be concentrated at the bottom of the market. The sub-$200 segment, where margins are already thin and consumers are most price-sensitive, will shrink the most. As a result, emerging markets such as Middle East and Africa (MEA), Central and Eastern Europe, and Asia Pacific excluding Japan and China (APeJC) are expected to face the strongest double-digit declines of 23%, 19% and 14% respectively, as these regions have the highest concentration of sub-$200 devices. In contrast, North America, holds up comparatively well, with only 6.3% decline. The region is dominated by the premium segment with 60% of shipments above $800 in 2026Q1with Apple and Samsung, who dominate the segment, being resilient to the crisis. China, is also forecast to decline double digits with 13% drop, as low-end Android players struggle to complete in new environment.
How will performance differ across vendors and Operating Systems?
While Android is forecast to witness a 20% YoY drop, the decline exposes two different realities. Samsung is expected to continue growing market share in 2026, defying the broader Android decline by expanding its position in the premium segment and taking share in the mid-range. The combination of secured memory supply, a stronger Galaxy S26 line-up, and aggressive positioning in the mid-range is allowing Samsung to capture demand that smaller Android vendors are unable to serve, as memory costs squeeze the BoM for Chinese vendors.
iOS forecast was improved from 8.1% decline to just 5.2% in 2026, a meaningful turn from Apple at a time when majority of the market is headed downwards. Apple has navigated the memory crisis with unusual resilience, securing the supply it needs and benefiting from exceptionally strong demand for the iPhone 17 series across developed markets and especially China.
“2026 will be a defining year for Apple,” said Francisco Jeronimo, vice president for Worldwide Client Devices, IDC. “In a year when the broader smartphone market will record its steepest decline in history, iOS will deliver its highest annual share ever, at 22%. Apple has done three things that few of its competitors have managed: it secured memory supply early, it built a portfolio strong enough to drive a remarkable turnaround in China, and it positioned the iPhone 17 to capture demand exactly when consumers in developed markets are extending replacement cycles and trading up. The shift in market share that follows from this crisis will benefit Apple more than any other vendor.”
HarmonyOS is the other bright spot. Huawei’s operating system is forecast to reach 62 million units in 2026, accelerating its growth from 42 million previously forecasted. Huawei has expanded HarmonyOS into the entry-level segment, sustained or reduced pricing on new models, and continued promotional support for older devices. The strategy has worked, particularly in China’s lower-tier cities, where the affordability gap created by rising Android ASPs has opened space for a domestic alternative.
Will foldable smartphones grow?
For the second consecutive year, foldables are the one product segment defying the downturn. The category is forecast to grow 20% year-on-year in 2026, supported by new models from existing players and, more importantly, Apple’s long-anticipated entry into the segment in the second half of the year. Foldables remain a small share of total smartphone volumes, but they are now the only segment where vendors can credibly defend premium pricing and grow units simultaneously.
What it means for vendors and the industry
Vendors with scale, supply leverage, and pricing power, namely Apple, Samsung, and Huawei within China, will gain share. Smaller Android brands, particularly those concentrated in entry-level price bands and emerging markets, will face the sharpest contractions and, in some cases, exit the market. ASPs are unlikely to return to 2025 levels within the forecast horizon. The sub-$100 segment, which accounted for over 170 million devices in 2025, becomes economically unviable as memory and NAND costs settle at a permanently higher level even after the memory shortage stabilizes in 2028, The next 18 months will determine who emerges from this reset with a sustainable position and who does not.
About IDC Trackers
IDC Tracker products provide accurate and timely market size, vendor share, and forecasts for hundreds of technology markets from more than 100 countries around the globe. Using proprietary tools and research processes, IDC’s Trackers are updated on a semiannual, quarterly, and monthly basis. Tracker results are delivered to clients in user-friendly Excel deliverables and on-line query tools.
For more information about IDC’s Worldwide Quarterly Mobile Phone Tracker, please contact Jackie Kliem at 508-988-7984 and jkliem@idc.com.
About IDC
International Data Corporation (IDC) is the premier global provider of trusted technology intelligence, advisory services, and events. With more than 1,000 analysts worldwide, IDC offers global, regional, and local expertise on technology, IT benchmarking and sourcing, and industry opportunities and trends in over 100 countries. IDC’s analysis and insights help IT professionals, business executives, and the investment community to make fact-based technology decisions and to achieve their key business objectives. To learn more about IDC, please visit www.idc.com. Follow IDC on X at @IDC and LinkedIn. Subscribe to the IDC Blog for industry news and insights.
All product and company names may be trademarks or registered trademarks of their respective holders.