Volné pozice

Chcete svůj skill dostat doslova do světa? Podívejte se, do jakých rolí teď sháníme nové kolegy.

Nenašli jste pozici, kterou jste hledali? Nevadí.

Na čem pracujeme

Spravujeme a vyvíjíme In-house software, jehož pomocí předáváme světu odborný pohled na to, co se v IT dělo, děje a také dít bude.

Výsledky naší práce pomáhají předním technologickým firmám dosáhnout ambiciózních cílů a našim kolegům k tomu, aby analyzovali IT trh co nejprecizněji.

Chcete mít jako první informace o tom, co se u nás děje?

Pracujte ve firmě, která inspiruje celý IT svět

DC není obyčejná datová společnost. U nás googlí Google, sbíráme data o Facebooku a data u nás nakupuje třeba Amazon. Začněte pracovat pro IDC a zjištěte sami, co všechno dovedeme.

Globální firma, individuální přístup

I když pracujeme pro ty největší globální IT hráče, udržujeme si neformální pracovní prostředí.

Nabízíme stabilitu a zázemí velké společnosti, která ale umí vyjít vstříc individuálním potřebám každého člena týmu.

Přečtěte si víc on naší firemní kultůře:

DŮVĚRA | DOBRÉ VZTAHY | WORK-LIFE BALANCE | INDIVIDUÁLNÍ PŘÍSTUP | MODERNÍ TECHNOLOGIE

Naši klienti:

Chcete mít jako první informace o tom, co se u nás děje?

Growth Expected to Pause for AR/VR Headsets, according to IDC

Global shipments for AR/VR headsets grew 10% in 2024 according to new data from the International Data Corporation (IDC) Worldwide Quarterly Augmented and Virtual Reality Headset Tracker. The launch of new products during the holiday quarter as well as multiple new entrants throughout the year helped the market return to growth after two years of declines.

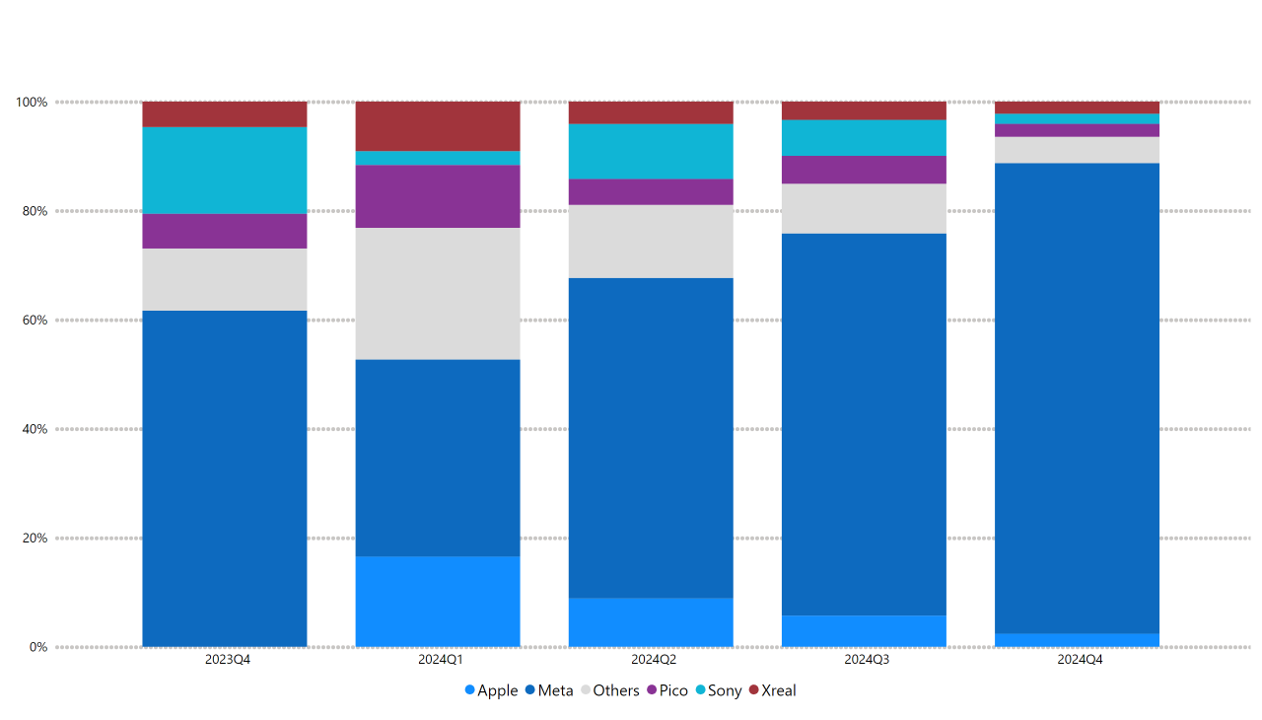
Meta continued to dominate capturing 74.6% share throughout the year followed by Apple at 5.2%, Sony with 4.3%, ByteDance capturing 4.1% and XREAL rounding out the top five with 3.3% share. However, amongst the top five only Meta and XREAL recorded year-over-year growth thanks to newer products and gaming focused use-cases. Both companies also managed to drive up average selling prices (ASP) for their respective brands by offering more premium solutions.

Throughout 2024, the launch of new headsets from Apple along with well received headsets such as the Quest 3 (and later 3S) as well as the Pico 4 led to an increase in commercial demand. Developers were eager to create mixed reality experiences with devices from Meta and Apple while those looking to scale deployments opted for Pico’s products in addition to Quest. Adding fuel to the fire was Meta’s push into the education segment which led the category to grow 69.4% in 2024 versus the prior year. In total, commercial shipments were up 14.9%.

“Last year was a great year for hardware as we got to see new mixed reality headsets from large brands such as Apple and Meta, and it was also a great year for smaller brands such as Even Realities and RayNeo each of which focused on slimming down the form factor and providing consumer friendly designs for glasses with displays, rivaling popular smart glasses such as Meta’s Ray-Bans but with added display tech,” said Jitesh Ubrani, research manager, Worldwide Mobile Device Trackers at IDC. “In 2025, we anticipate even more glasses with displays and multi-modal artificial intelligence along and the introduction of Android XR hardware which is likely to lead to platform rivalries among the key players: Meta, Apple, Google, and everyone else.”

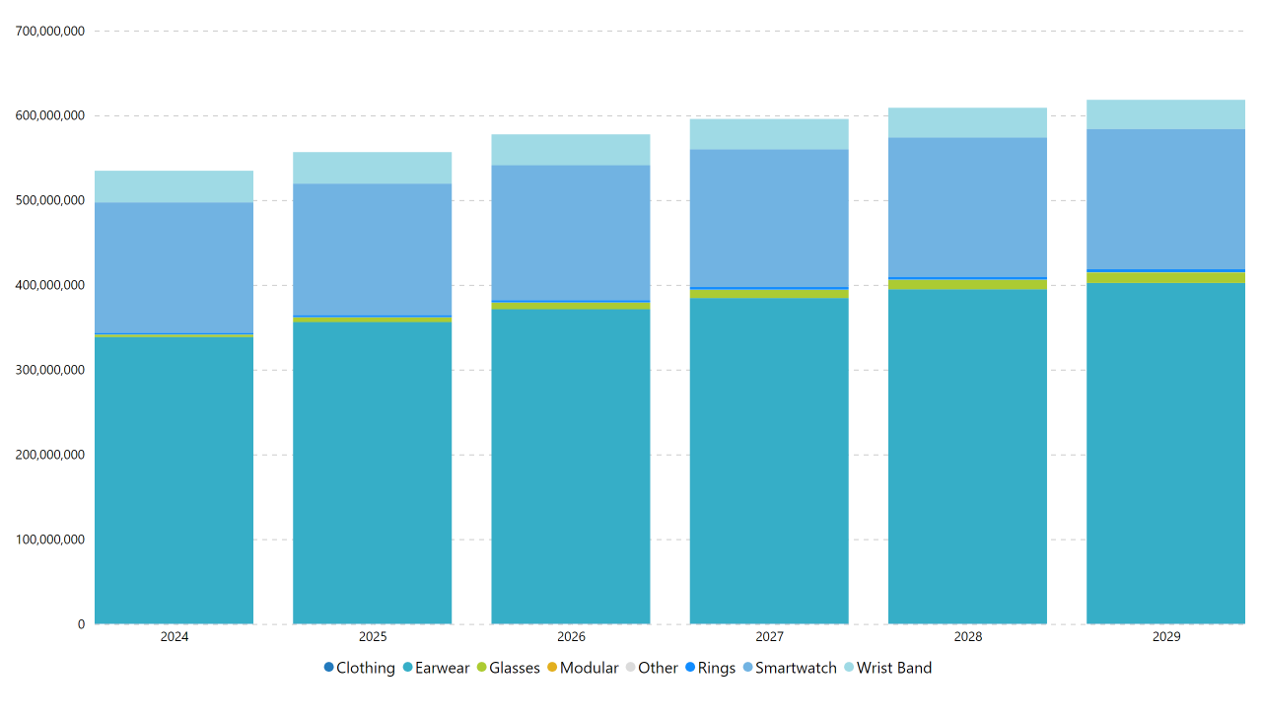
Despite newer hardware expected in 2025, IDC forecasts an annual decline of 12% as supply indicators point to delayed launches for some key players though a rebound is expected in 2026 with 87% growth and volume will surpass the peak of 11.2 million units recorded during the pandemic in 2021. Between 2025 and 2029, IDC anticipates a compound annual growth rate (CAGR) of 38.6%.

As the ARVR market grows, so will the opportunity for consumer and commercial usage.

“Historically, virtual reality (VR) has been the domain of consumers thanks to gaming and multimedia consumption while augmented reality (AR) has primarily centered on commercial users to expedite workflows,” points out Ramon T. Llamas, research director with IDC’s XR Hardware and Interactive 3D Software team. “The rise of mixed reality (MR) stands to cater to both user groups with both immersive virtual experiences and the ability to see digital content on a projected view of a user’s environment. Meanwhile, extended reality (ER) has already caught on with consumers for gaming and multimedia consumption, but it isn’t hard to envision how businesses can leverage this technology for their users and their customers. This gives the market choices around the types of experiences they want to have and how much they want to spend.”

2024 Q4 Historical ARVR Market Share

QuarterMeta
SonyAppleByteDanceXrealOthers
2023Q461.6%15.9%0.0%
6.4%
4.7%11.4%
2024Q136.2%2.5%16.5%11.5%9.1%24.2%
2024Q258.8%10.1%8.9%4.8%4.1%13.4%
2024Q370.1%6.6%5.7%5.1%3.4%9.1%
2024Q486.3%1.8%2.4%2.4%2.2%4.8%

Translate Insights Into Action – IDC's CIO Executive Council Executive Network


IDC's CIO Executive Council Executive Network eBook

Download this informative eBook to learn about the Executive Network Program – a members-only community of IT advisors and global technology and business leaders empowered by peer support and a distinctive blend of programming, content, engagement and relevant career development tools. Members of the Executive Network community are committed to developing and deploying innovative and transformational digital technology initiatives that have a direct and significant impact on business success and growth at the world’s most influential and evolving organizations.

Wearables Market Continues to Grow Amid Shifts in Consumer Preferences

The global wearables market reached 534.6 million units in 2024, marking a 5.4% year-over-year growth, according to the latest data from the International Data Corporation (IDC) Worldwide Quarterly Wearable Device Tracker. Despite this growth, the market is expected to slow to 4.1% in 2025 as major markets like the US and India, along with key device categories such as smartwatches and hearables, approach maturity.

Looking ahead to 2025 and beyond, the wearables market is expected to experience a more moderate growth trajectory. Smartwatches, which have been a cornerstone of the wearables market faced a challenging year in 2024, declining 4.5%. This decline was largely driven by the influx of low-cost options in India, leading to elevated inventory levels and raising concerns about the sustainability of aggressive pricing strategies. In the US, the market also contracted as many consumers continued to use devices purchased during the pandemic. However, a modest recovery is anticipated in 2025, with smartwatch shipments expected to grow by 0.9% as consumers begin to upgrade their older devices. Meanwhile, global smartwatch shipments are on track to grow 2.5% in 2025.

Hearables remained the largest category within the wearables market and grew by 8.9% in 2024. This growth is set to continue in the coming years, driven by emerging markets and regular refresh cycles. Innovations such as open-ear designs and ongoing reductions in average selling prices (ASP) are fueling this category’s expansion.

Overall, the wearables market is evolving, with new form factors and innovative products driving growth. As consumer preferences shift, vendors will need to adapt their strategies to stay competitive in this dynamic landscape.

Worldwide Wearables Forecast by Product

YearEarwearSmartwatchWrist BandGlassesRingsClothingOther
2025355,795,354155,307,65737,132,4705,473,4122,331,774332,164252,355
2026370,915,452159,125,10336,443,9757,742,7482,746,915348,148256,911
2027384,153,272162,518,09435,756,4329,625,3233,052,251356,334261,826
2028394,456,315164,373,26235,063,19611,134,8853,288,606360,927266,376
2029401,877,880165,585,29534,316,62112,442,8183,464,284368,686269,345

Top 5 Wearable Device Companies

QuarterAppleHuaweiImagine MarketingSamsungXiaomiOthers
2023Q425.3%7.3%3.9%8.4%8.4%46.7%
2024Q118.2%9.9%5.4%9.3%10.4%46.7%
2024Q217.9%10.9%6.4%8.2%9.0%47.7%
2024Q319.7%8.1%8.3%8.8%10.6%44.5%
2024Q423.8%8.2%4.4%8.0%11.8%43.8%

Interested in another Market Area?

Worldwide Smartphone Market Grows 1.0% in Q2 2025, Despite Global Uncertainty and Weak Demand in China, according to IDC

Vendors Continue to Push Higher Price Points to Offset the Slowdown in Unit Shipments by Offering AI in More Affordable Devices


NEEDHAM, Mass., July 14, 2025 – According to preliminary data from the International Data Corporation (IDC) Worldwide Quarterly Mobile Phone Tracker, global smartphone shipments increased 1.0% year-over-year (YoY) to 295.2 million units in the second quarter of 2025 (2Q25). The smartphone market remained positive, however uncertainty fueled by tariffs volatility, on-going macro-economic challenges such as forex instability, unemployment and inflation across regions have tapered demand, making consumers deprioritize spending on smartphones, especially in low-end segments.

“Economic uncertainty tends to compress demand at the lower end of the market, where price sensitivity is highest.  As a result, low-end Android is witnessing a crunch weighing down overall market growth,” said Nabila Popal, senior research director for Worldwide Client Devices, IDC. “Additionally, lower than expected performance in China also contributed to the flat global growth. China declined in Q2 as subsidies failed to stimulate demand. Although the 618 e-commerce festival was a success in terms of sell out, OEMs and channel partners used the promotions to clear inventory rather than increase shipments. While Apple was the top brand during the promotion period, it saw a 1% drop in China in Q2, offset by strong double-digit growth in emerging markets leading to a 1.5% growth globally in the quarter.”

“Samsung was able to consolidate its market leadership and outperform the overall market achieving strong growth in the quarter driven by the sales of its new Galaxy A36 and A56 products,” said Francisco Jeronimo, vice president, Client Devices, IDC. “These new products introduce AI-enabled features to mid-range devices, which has been effectively used in retail stores to drive sales, as more consumers become curious about AI.”

“In the face of ongoing political challenges, the impact of war, and the complexities posed by tariffs, the 1% growth in the smartphone market stands as a critical indicator that the market is poised to return to growth,” said Anthony Scarsella, research director for Client Devices, IDC. “Q2 was packed with new models, featuring innovative designs and the powerful integration of AI, which drove the 8th consecutive quarter of growth — a feat we have not witnessed since 2013.”

Top 5 Companies, Worldwide Smartphone Shipments, Market Share, and Year-Over-Year Growth, Q2 2025

(Preliminary results, shipments in millions of units)

Company2Q25
Shipments
2Q25
Market Share
2Q24
Shipments
2Q24
Market Share
Year-Over-Year
Change
Samsung58.019.7%53.818.4%7.9%
Apple46.415.7%45.715.6%1.5%
Xiaomi42.514.4%42.314.5%0.6%
vivo27.19.2%25.98.8%4.8%
Transsion25.18.5%25.58.7%-1.7%
Others96.132.6%99.133.9%-3.1%
Total295.2100.0%292.2100.0%1.0%
Source: IDC Quarterly Mobile Phone Tracker, July 14, 2025

Table Notes:

  • Data are preliminary and subject to change.
  • Company shipments are branded device shipments and exclude OEM sales for all vendors.
  • The “Company” represents the current parent company (or holding company) for all brands owned and operated as a subsidiary.
  • Figures represent new shipments only and exclude refurbished units.
  • IDC declares a statistical tie in the Smartphone market when there is a difference of one-tenth of one percent (0.1%) or less in the shipment shares among two or more companies.

About IDC Trackers

IDC Tracker products provide accurate and timely market size, vendor share, and forecasts for hundreds of technology markets from more than 100 countries around the globe. Using proprietary tools and research processes, IDC’s Trackers are updated on a semiannual, quarterly, and monthly basis. Tracker results are delivered to clients in user-friendly Excel deliverables and on-line query tools.

For more information about IDC’s Worldwide Quarterly Mobile Phone Tracker, please contact Jackie Kliem at 508-988-7984 and jkliem@idc.com.

Click here to learn about IDC’s full suite of data products and how you can leverage them to grow your business.

About IDC

International Data Corporation (IDC) is the premier global provider of market intelligence, advisory services, and events for the information technology, telecommunications, and consumer technology markets. With more than 1,300 analysts worldwide, IDC offers global, regional, and local expertise on technology, IT benchmarking and sourcing, and industry opportunities and trends in over 110 countries. IDC’s analysis and insight helps IT professionals, business executives, and the investment community to make fact-based technology decisions and to achieve their key business objectives. Founded in 1964, IDC is the world’s leading tech media, data, and marketing services company. To learn more about IDC, please visit www.idc.com. Follow IDC on Twitter at @IDC and LinkedIn. Subscribe to the IDC Blog for industry news and insights.


All product and company names may be trademarks or registered trademarks of their respective holders.

Contacts:

Escalate PR for IDC

IDC@escalatePR.com


Nabila Popal

npopal@idc.com

+1 571-373-1816


Francisco Jeronimo

fjeronimo@idc.com

+44 77 9630 1919


Anthony Scarsella

ascarsella@idc.com

+1 508-308-3301

Interested in another Market Area?

IDC MarketScape

Choosing the right vendors to provide ICT products and services to your organization is a critical component to achieving success.

IDC MarketScape is the ICT industry’s premier vendor assessment tool, providing in-depth quantitative and qualitative technology market assessments of ICT vendors for a wide range of technology markets. This comprehensive assessment of market competitors, delivered in a full-length research report, and summarized in an easy-to-read graphical depiction, provides you with the critical information necessary to make your most important technology decisions.

IDC MarketScape assesses a specific offering from a particular vendor based on an inclusion criteria. The evaluation leverages a balanced view of the vendor’s strategies and offering capabilities to give an objective opinion that helps technology buyers determine the best solution.

The IDC MarketScape graph shows the vendor’s position in four distinct categories and their relative market share is represented by the bubble size.

Divisions between chart segments (Leaders, Major Players, Contenders, and Participants) change based on weightings between the two axes, Capabilities and Strategies.

Vendor market share is represented by the size of the individual bubble icon in the chart.

IDC provides a different perspective on ICT markets, informed by its global research assets and its culture of methodological rigor. As the industry’s leading ICT forecast and market share provider, IDC is uniquely positioned to provide a robust and unbiased vendor assessment

For more information about IDC MarketScape, please contact us (Same page link) .

Why IDC MarketScape?

What sets IDC MarketScape apart is its rigorous scoring methodology, looking beyond market share and providing a clear framework comparing the product and service offerings, capabilities and strategies, and current and future market success factors for each vendor.

IDC MarketScape Helps

IT Buyers

  • Evaluate specific products and services across a wide range of technology markets
  • Identify vendors that best meet your specific selection criteria
  • Confirm investment decisions with a 360-degree assessment of current and prospective vendors


IT Vendors

  • Validate your competitive position in the relevant markets
  • Support your marketing messages through unbiased, third-party content
  • Gain mindshare with your customers and prospects
  • For more information about IDC MarketScape, please contact us (Same page link)

Contact Us

Slow Q4 Drags Industrial Printer Shipments Lower in 2024, According to IDC

NEEDHAM, Mass., March 18, 2025 Shipments of industrial printers declined by 1% in 2024 compared to 2023, according to the newest release from the International Data Corporation (IDC) Worldwide Quarterly Industrial Printer Tracker. Total shipments in the fourth quarter were 5% lower than they were in Q4 2023, which dragged overall shipments down for the year.

“For all of 2024 there were industrial printer segments where shipments grew nicely and somewhere shipments were flat or in decline. The end result is that total industrial printer shipments were slightly lower for the year.” said Tim Greene, research director, Hardcopy Solutions at IDC. “We are seeing a trend through 2024 across some of these segments towards faster, more productive, more automated solutions that is driving changes in value of shipments in various regions.”

Worldwide Industrial Segment Highlights for all of 2024

  • Large format digital printer shipments declined by 1.2% compared to 2023.
  • Year-over-year growth in direct-to-shape (7.8%) and industrial textile (+12.3%) printers was
    largely offset by declines in the direct-to-garment segment (-12.3%).
  • Label & packaging printer shipments grew by 19.4% compared to 2023.

Worldwide Industrial Segment Highlights for Q4 2024

  • Q4 was the strongest quarter in all of 2024 for large format printer shipments on a worldwide basis but was still 5% below Q4 in 2023.
  • DTG printer shipments declined by 6% in Q4 2024 compared to Q4 2023.
  • Industrial textile printer shipments grew by 6.3% in Q4 2024 compared to Q4 2023.
  • Label & packaging printer shipments grew by 6.8% in Q4 2024 compared to Q4 2023.

Regional Analysis for all of 2024

  • Latin America (19.7%) and Central & Eastern Europe (4.0%) were the fastest growing regions for all of 2024.
  • North America represented 25% of total industrial printer shipments in 2024, but shipments declined by almost 6% compared to 2023.
  • Japan had modest growth in total industrial printer shipments in 2024 compared to 2023.
  • Western Europe and China both saw modest declines in shipments compared to 2023.

Regional Analysis for Q4 2024

  • For the fourth quarter shipments of industrial printers in North America were essentially flat compared to Q3 2024.
  • Latin America was a bright spot with shipments up by 22.3% in Q4.
  • While the APJ region was down overall in Q4, industrial printer shipments in Japan grew by 1.2% compared to Q4 in 2023.
  • Shipments in Central & Eastern Europe increased 7.2% in Q4 while shipments were off in Western Europe by 3.6% compared to Q4 2023.

Worldwide Industrial Printer Shipments and Shipment Value Share and Sequential Growth, Q4 2024

Product Category4Q24
Share of Shipments
4Q24/3Q24
Shipment change
4Q24
Share of Shipment Value
4Q24/3Q24
Shipment Value Growth
Desktop Label9.3%12.65%3.36%19.32%
Direct to Garment1.0%-6.49%4.37%3.49%
Direct to Shape1.5%-1.92%2.69%-0.92%
Industrial Textile0.8%-2.99%10.19%2.50%
Label & Packaging0.5%2.79%17.42%29.50%
Large Format86.9%4.62%61.97%2.36%
Total100.0%5.02%100.0%6.74%

Industrial Printer Tracker

IDC’s Worldwide Quarterly Industrial Printer Tracker provides total market size and vendor share for five major market categories: large format, label and packaging, direct to garment, industrial textile, and direct to shape. In addition to units, shipment value, and ASP, the Tracker also provides market results for each product category by ink type, media size, hardware class, or primary application across nine geographic regions and 90 countries.

About IDC Trackers

IDC Tracker products provide accurate and timely market size, vendor share, and forecasts for hundreds of technology markets from more than 100 countries around the globe. Using proprietary tools and research processes, IDC’s Trackers are updated on a semiannual, quarterly, and monthly basis. Tracker results are delivered to clients in user-friendly Excel deliverables and on-line query tools.

Click here to learn about IDC’s full suite of data products and how you can leverage them to grow your business.

About IDC

International Data Corporation (IDC) is the premier global provider of market intelligence, advisory services, and events for the information technology, telecommunications, and consumer technology markets. With more than 1,200 analysts worldwide, IDC offers global, regional, and local expertise on technology, IT benchmarking and sourcing, and industry opportunities and trends in over 110 countries. IDC’s analysis and insight helps IT professionals, business executives, and the investment community to make fact-based technology decisions and to achieve their key business objectives. Founded in 1964, IDC is a wholly owned subsidiary of International Data Group (IDG), the world’s leading tech media, data, and marketing services company. To learn more about IDC, please visit www.idc.com. Follow IDC on Twitter at @IDC and LinkedIn. Subscribe to the IDC Blog for industry news and insights.

All product and company names may be trademarks or registered trademarks of their respective holders.

Interested in another Market Area?

Worldwide Hardcopy Peripherals Market, Unit Shipments, Company Share, and Year-Over-Year Growth, Q4 2024 (based on unit shipments)

NEEDHAM, Mass., March 16, 2025 – In the fourth quarter of 2024, the global Hardcopy Peripherals (HCP) market experienced a 3.1% year-over-year (YoY) growth, with nearly 22 million units shipped. This marks the second consecutive quarter of positive YoY growth, as reported by the IDC Worldwide Quarterly Hardcopy Peripherals Tracker.

The fourth quarter of 2024 showed varied regional outcomes. Five out of nine regional markets recorded positive YoY growth, including Western Europe (10.5%), Asia Pacific (excluding Japan and PRC) (5.4%), Latin America (29.5%), the Middle East & Africa (4.3%), and Canada (10.6%). These increases were attributed to improved economic conditions in certain regions and attractive promotions from key vendors.

Company4Q24
Unit Shipments
4Q24
Market Share %
4Q23
Unit Shipments
4Q23
Market Share %
4Q24/4Q23
Growth %
1. HP Inc.7,502,35634.2%7,055,55233.2%+6.3%
2. Epson4,944,91322.5%4,693,38422.1%+5.4%
3. Canon Group4,466,24020.4%4,505,96921.2%-0.9%
4. Brother2,146,5509.8%2,011,9449.5%+6.7%
5. Pantum639,7772.9%557,9702.6%+14.7%
Others2,245,44910.2%2,457,98411.5%-8.6%
Total21,945,285100.0%21,282,803100.0%+3.1%
<br>

Source: IDC Worldwide Quarterly Hardcopy Peripherals Tracker, February 6, 2025

Notes:

  • IDC tracks A3-A4 devices in the Quarterly Hardcopy Peripherals.
  • Hardcopy Peripherals include single-function printers, multifunctional systems (MFPs), and single-function digital copiers (SF DC). Data for all vendors are reported for calendar periods.

Worldwide Hardcopy Peripherals Market, Unit Shipments, Company Share, and Year-Over-Year Growth, Q4 2024 (based on unit shipments)

Data table for “Worldwide Hardcopy Peripherals Market, Unit Shipments, Company Share, and Year-Over-Year Growth, Q4 2024 (based on unit shipments) ” chart

Company4Q23 Market
Share %
1Q24 Market
Share %

2Q24 Market

Share %
3Q24 Market
Share %
4Q24 Market
Share %
HP Inc.33%35%35%35%34%
Epson22%22%20%22%23%
Canon Group21%19%21%21%20%
Others12%12%11%10%10%
Brother9%9%10%9%10%
Pantum3%3%3%2%3%
Total100.0%100.0%100.0%100.0%100.0%

Interested in another Market Area?

Worldwide Server Market grew by 89.0% in spending in the fourth quarter of 2024, driven by the continued mass deployment of GPU servers while keeping a 16.3% CAGR in a Five-Year Period, according to IDC.

The server market grew by 89.0% in spending in the fourth quarter of 2024, and by 73.5% for the year, driven by the continued mass deployment of GPU servers by hyperscalers and other large IT buyers. Non-accelerated server growth continued to recover, and overall unit growth was strong at 16.9% year over year. An aging installed base and pent-up demand have helped drive the 2024 recovery and market expansion, and the launch of new generation processors late in 2023 is contributing to this cycle as well, as the tech transition to new CPU platforms has been in full force during 2024. Large cloud service providers will continue their accelerated infrastructure expansion throughout the forecast period, while the rest of the market will try to find a balance for AI investments between on premises deployments and cloud services.

The market is expected to grow over the next five years at 16.3% CAGR by 2029. The macroeconomic environment will continue to be a defining factor for market performance through 2025, with last year’s optimism being replaced by uncertainty surrounding tariffs and other policy changes. DeepSeek’s market impact has been eased as they needed more infrastructure than was initially reported, and the evolution from simple chatbots to reasoning models to agentic AI will require several orders of magnitude more processing capacity, especially for inferencing. So even though the raise of more efficient models will require fewer resources, the market still will be growing at double digit pace as the new use cases are still underserved by current infrastructure.

Worldwide Server Market Forecast 2023 – 2025 Value (US$M)

YearNon-x86
Value (US$M)
OEM Value
Non-x86
Annual
Growth %
x86 Value
(US$M)
x86 Annual
Growth %
Total Value
(US$M)
Total
Annual
Growth %
2023$50,108161.6%$193,98059.5%$244,08873.4%
2024$74,72549.1%$232,00019.6%$306,72425.7%
2025$92,05823.2%$262,15413.0%$354,21215.5%